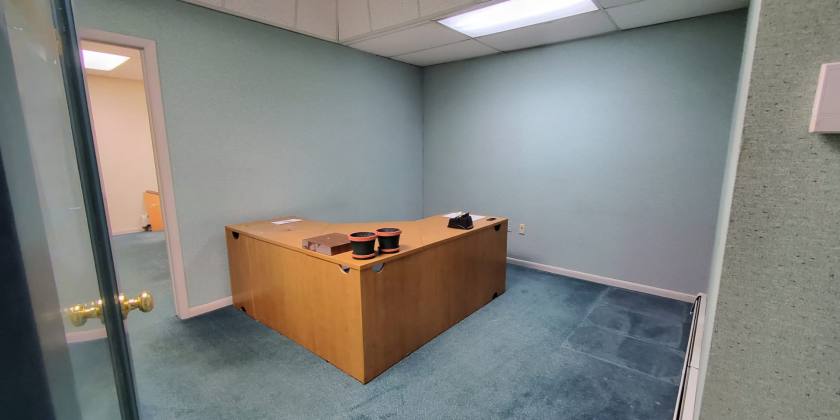
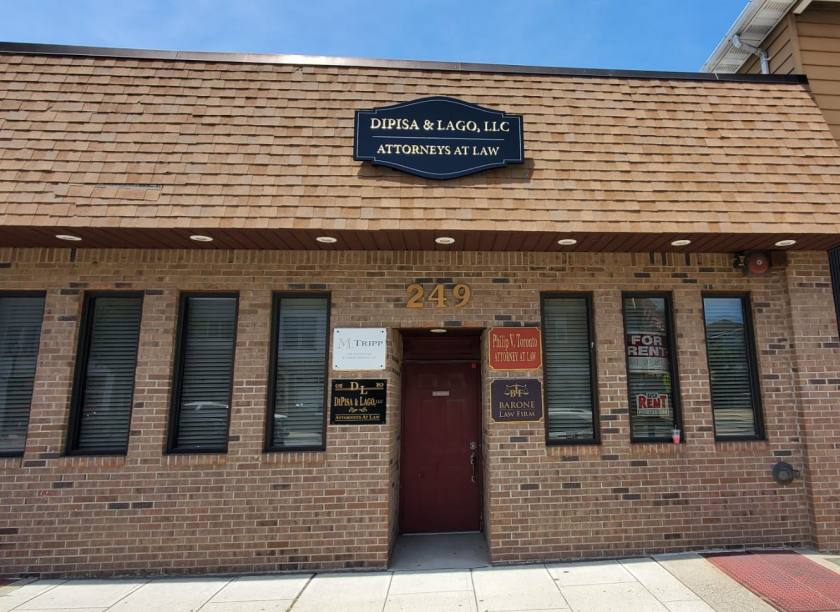
1-Mile | 3-Miles | 5-Miles | ||
---|---|---|---|---|
Total Population | 25,712 | 253,608 | 565,204 | |
Population Median Age | 40 | 38 | 39 | |
Population by Age | 0-9 Yrs | 2398 (9%) | 31241 (12%) | 67559 (11%) |
10-19 Yrs | 3399 (13%) | 30649 (12%) | 68046 (12%) | |
20-29 Yrs | 3263 (12%) | 36323 (14%) | 77031 (13%) | |
30-39 Yrs | 3528 (13%) | 38383 (15%) | 82752 (14%) | |
40-49 Yrs | 3271 (12%) | 33670 (13%) | 73270 (12%) | |
50-59 Yrs | 4188 (16%) | 33571 (13%) | 76484 (13%) | |
60-69 Yrs | 2886 (11%) | 24857 (9%) | 61557 (10%) | |
70+ Yrs | 2779 (10%) | 24913 (9%) | 58505 (10%) | |
Median HH Income | $86,997 | $69,142 | $79,040 | |
Total Household Income | < 24K | 1218 (13%) | 16812 (18%) | 31837 (15%) |
25-49K | 1661 (17%) | 17493 (19%) | 34226 (17%) | |
50-74K | 1197 (12%) | 15112 (16%) | 30373 (15%) | |
75-99K | 1205 (12%) | 11359 (12%) | 25434 (12%) | |
100-199K | 2780 (29%) | 23315 (25%) | 55853 (27%) | |
200K+ | 1248 (13%) | 7961 (8%) | 23372 (11%) | |
Highest Education Level | No Diploma | 1833 | 27288 | 49444 |
Diploma or GED | 4812 | 54821 | 114270 | |
Some College | 3420 | 28625 | 61999 | |
Assoc. Degree | 1094 | 11296 | 24450 | |
Bachelors Degree | 4503 | 34466 | 92015 | |
Higher Degree | 2663 | 18011 | 49266 | |
Total Housing Units | 9,768 | 97,536 | 211,424 | |
--Owner-Occupied | 5,295 | 37,822 | 100,892 | |
--Renter-Occupied | 4,014 | 54,229 | 100,203 | |
Owner-Occupied Values | < 100K | 155 | 1456 | 2852 |
100-199K | 152 | 2705 | 5011 | |
200-299K | 411 | 6067 | 15015 | |
300-399K | 1592 | 12182 | 31655 | |
400-499K | 1626 | 8597 | 23308 | |
500K+ | 1358 | 6815 | 23052 | |
Total Working Age Population | 21,483 | 204,633 | 456,946 | |
In Work Force | 14,894 | 136,016 | 304,903 | |
Not In Work Force | 6,590 | 68,616 | 152,043 | |
Workforce Employed | 14,334 | 128,660 | 288,382 | |
Workforce Unemployed | 560 | 7,247 | 16,235 | |
Civlian Workforce | 14,894 | 135,908 | 304,617 | |
Military Workforce | 0 | 109 | 287 | |
Total Households | 9,309 | 92,051 | 201,095 | |
Family Households | 6,295 | 61,663 | 140,937 | |
Non-Family Households | 3,014 | 30,389 | 60,158 | |
Married Couple | 4,918 | 40,287 | 97,173 | |
Other Family | 1,378 | 21,376 | 43,764 | |
Married w/Child | 1,920 | 17,398 | 41,539 | |
Single Male w/Child | 135 | 2,154 | 4,008 | |
Single Female w/Child | 604 | 7,766 | 13,961 |
Population Change Last Two Decades - Plus Projection
2000 | % | 2010 | % | 2020 | % | 2030 | |
---|---|---|---|---|---|---|---|
New Jersey | 8,414,350 | +4 | 8,791,894 | +4 | 9,132,700 | +4 | 9,530,900 |
Hudson County | 608,975 | +4 | 634,266 | +12 | 708,100 | +6 | 747,400 |
Essex County | 793,633 | -1 | 783,969 | +3 | 808,300 | +3 | 829,800 |
Bergen County | 884,118 | +2 | 905,116 | +7 | 967,500 | +7 | 1,031,500 |
Passaic County | 489,049 | +2 | 501,226 | +4 | 521,700 | +3 | 536,100 |
Total Working Age Population:
Total Households:
Total Working Age Population:
Total Households:
Total Working Age Population:
Total Households: