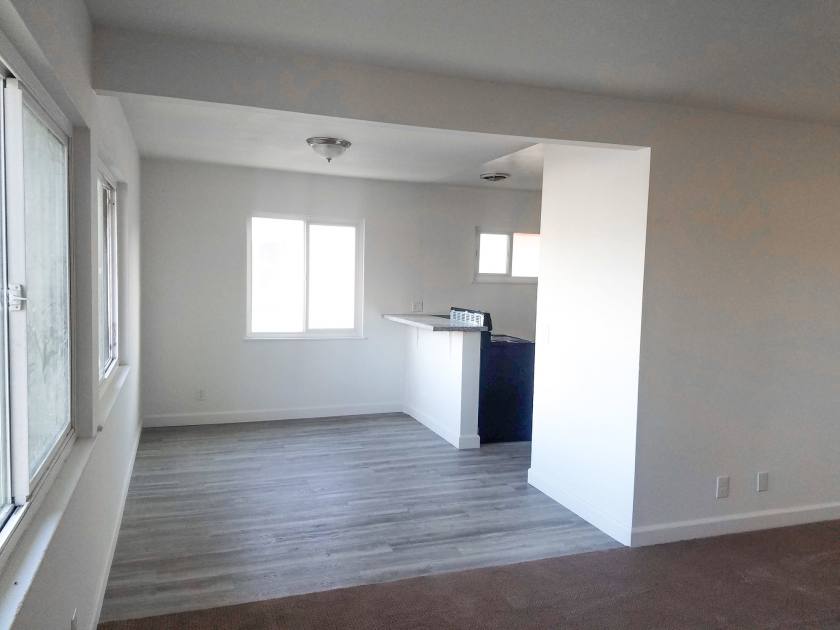
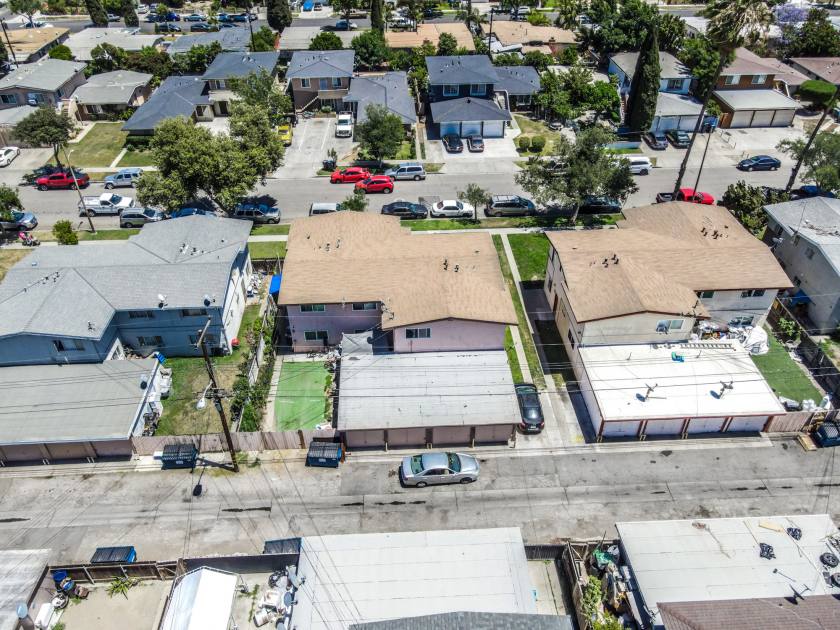
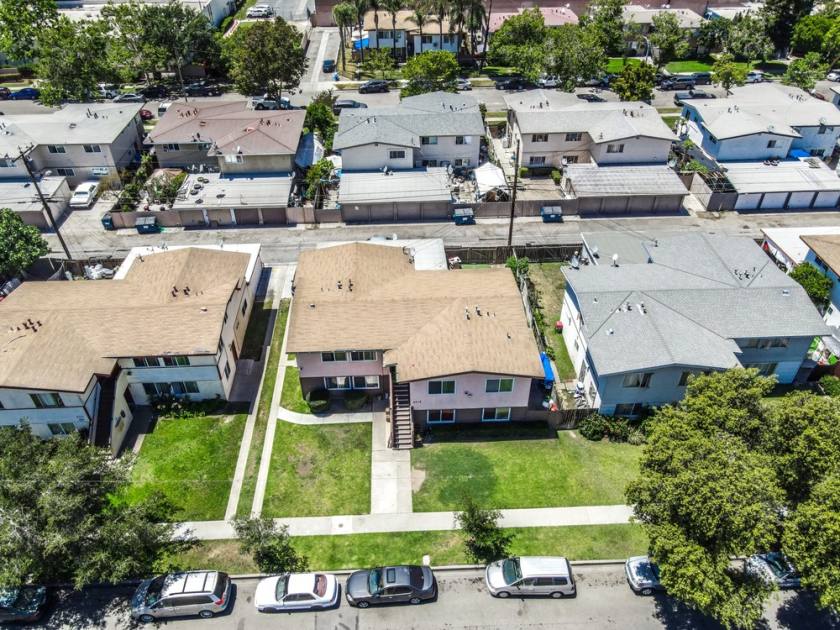
Multifamily Housing
2516 South Rosewood Avenue Santa Ana, CA 92707
2516 South Rosewood Avenue Santa Ana, CA 92707
Details & Description
Property Highlights
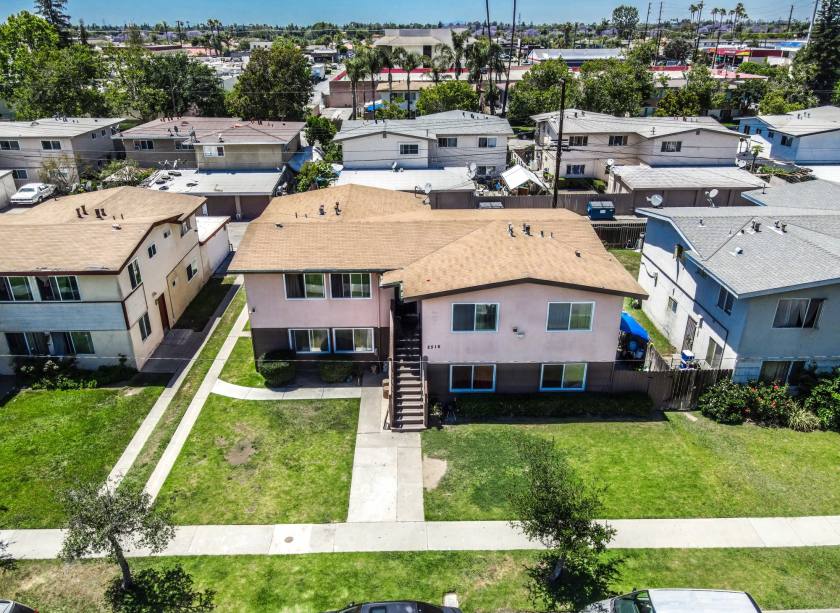
- • 4 Single Car Garages
- • 1 Uncovered Parking Space
- • Potential Additional Yard Parking for Unit B
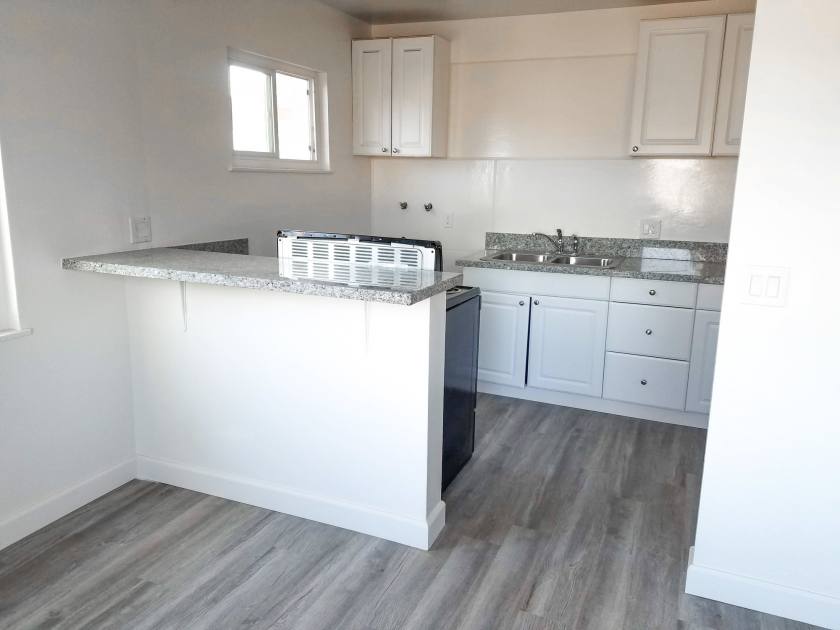
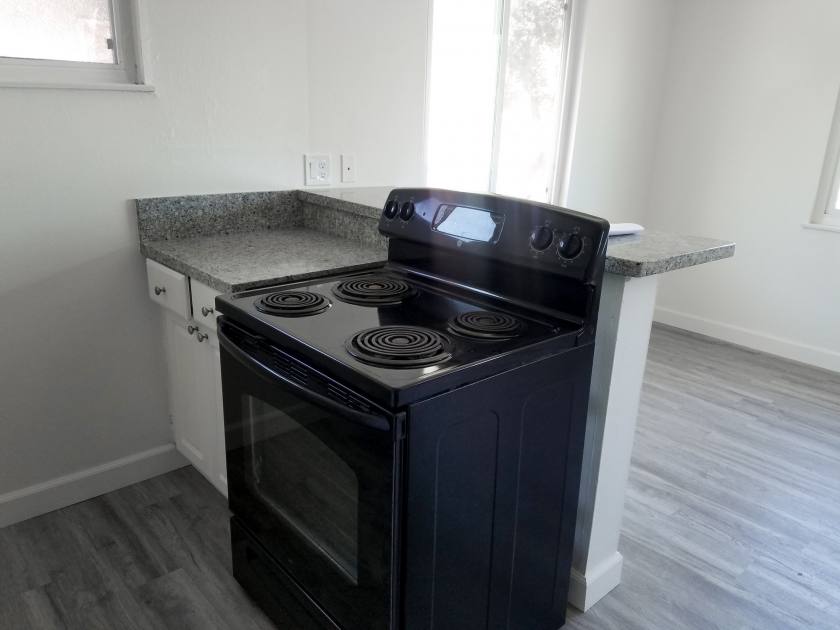
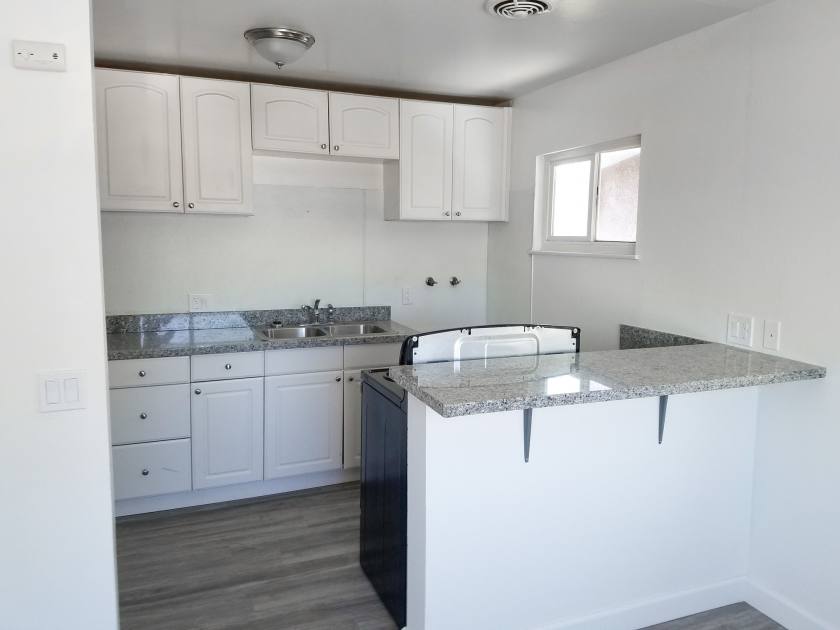
- • Granite Kitchen Countertops
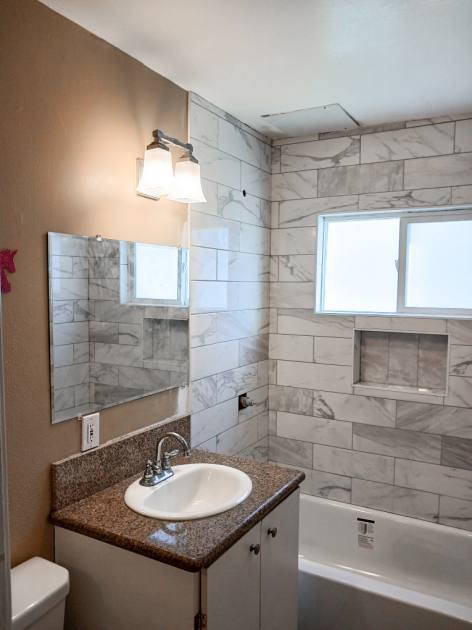
Additional Photos
Listing Agents

Sophia Mehr
O: 714-446-0600
M: 714-920-0022
sophia.mehr@svn.com
O: 714-446-0600
M: 714-920-0022
sophia.mehr@svn.com
While we strive to provide the most accurate information, all listing information, and demographic data, is provided by third-parties. As such, MyEListing will not be responsible for the accuracy of the information. It is strongly recommended that you verify all information with the listing agent, and any relevant agencies, prior to making any decisions.