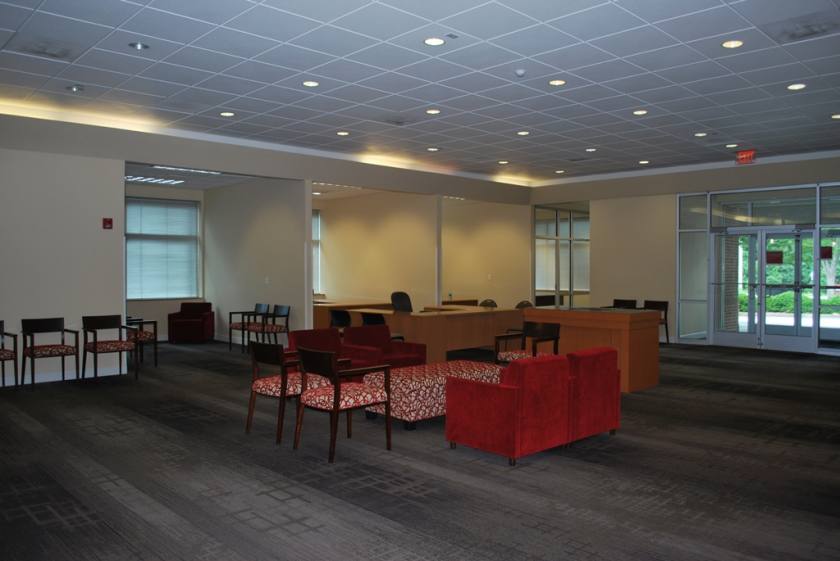
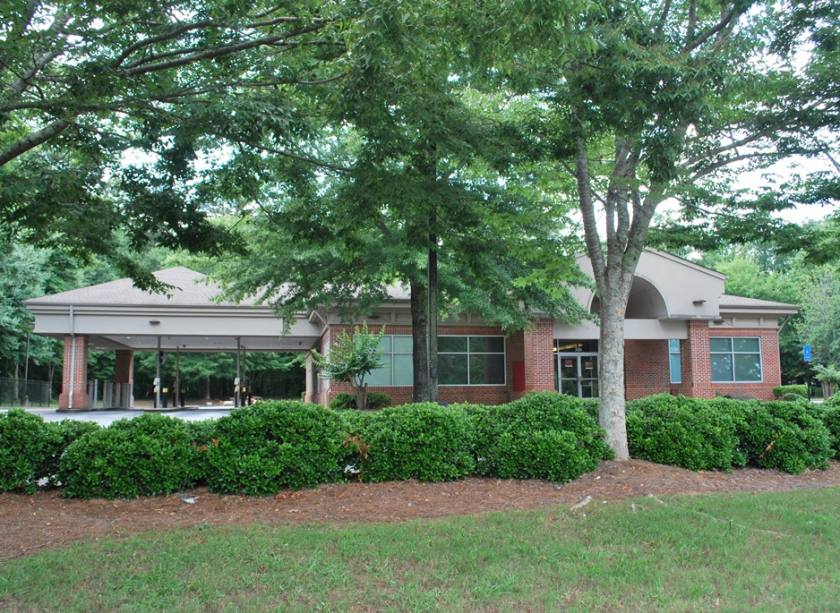
Office Space
326 Georgia 314 Fayetteville, GA 30214
326 Georgia 314 Fayetteville, GA 30214
Details & Description
Property Highlights
- • Frontage on Hwy 314 and New Hope Road
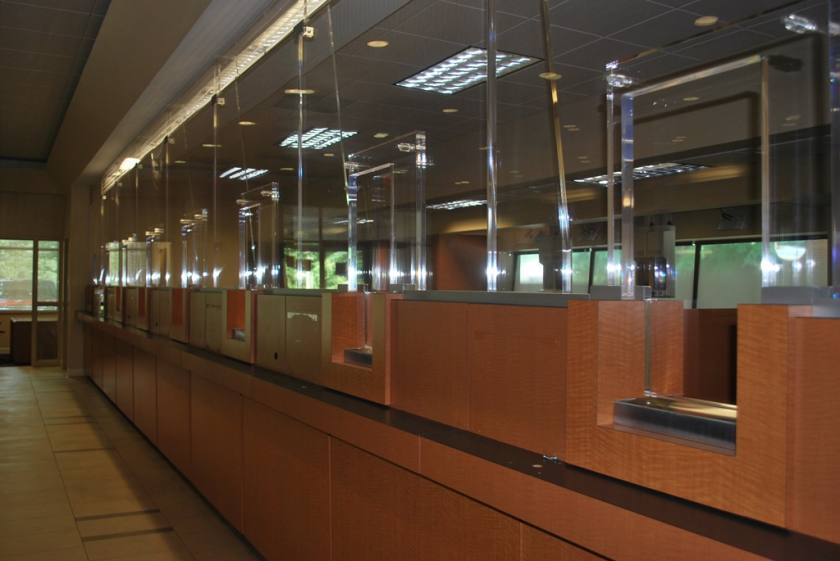
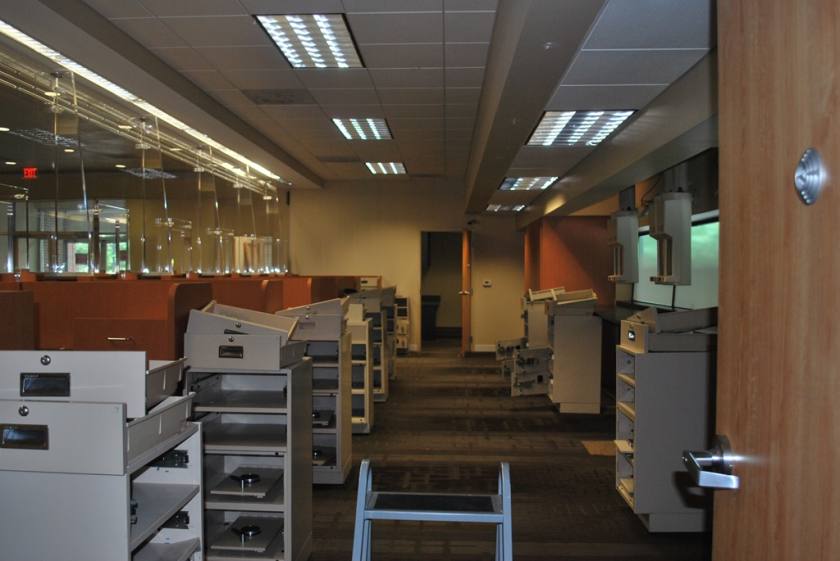
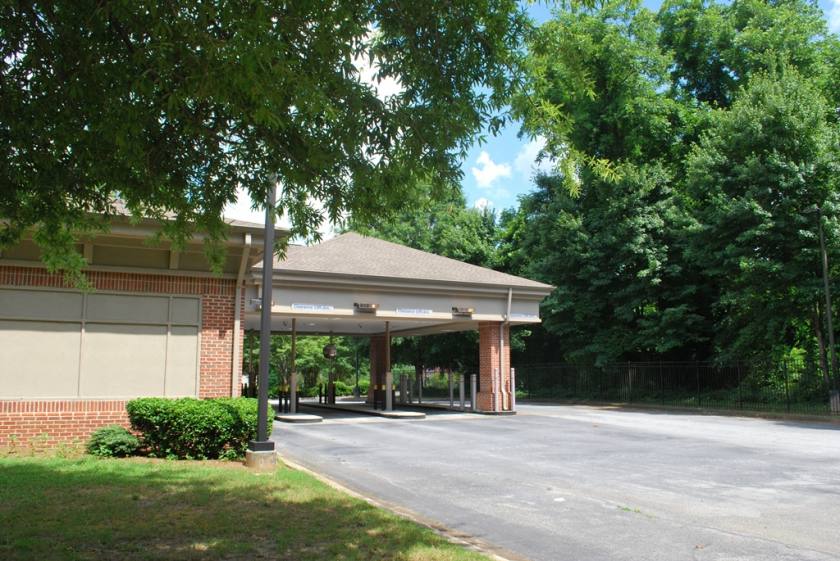
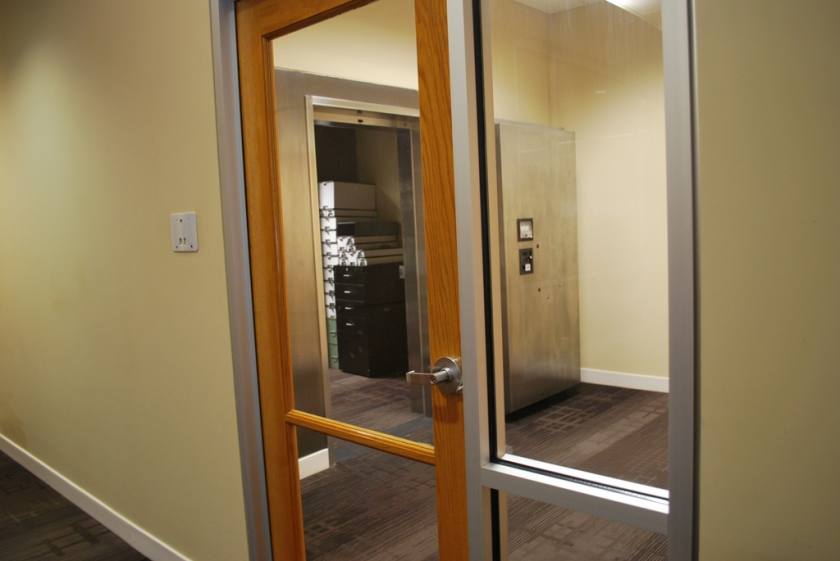
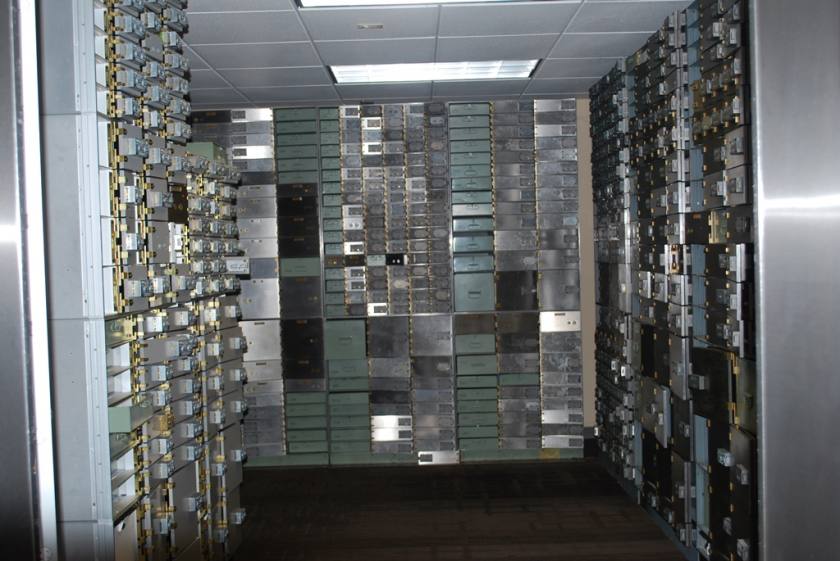
- • Former bank building with 3 drive throughs
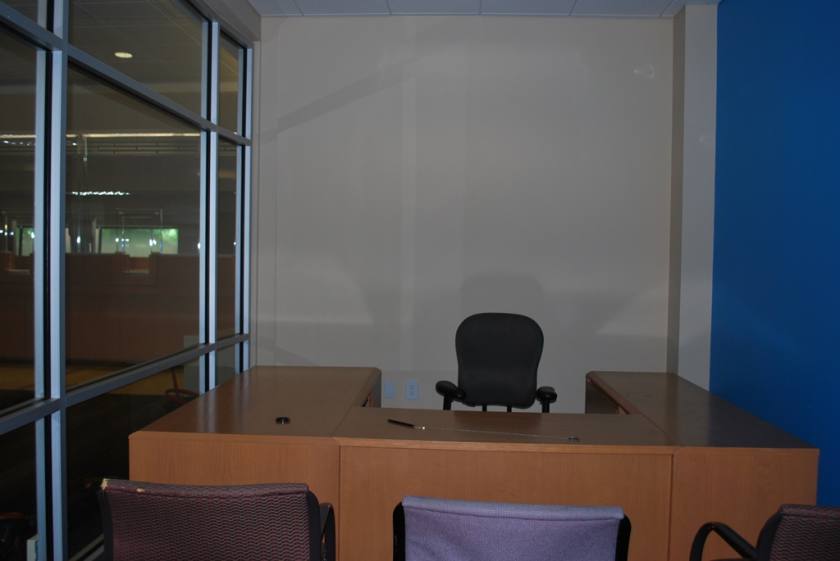
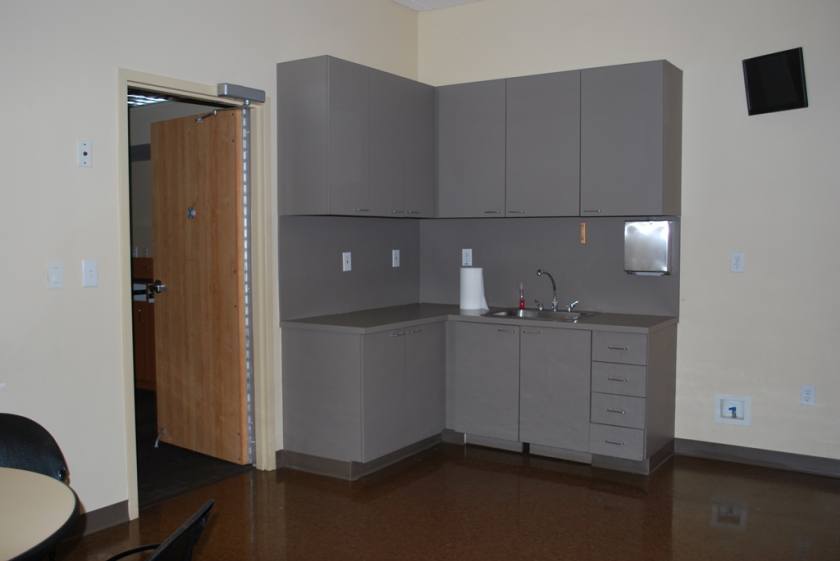
- • Great for medical office use
- • Convenient to restaurants, shops, banks, more
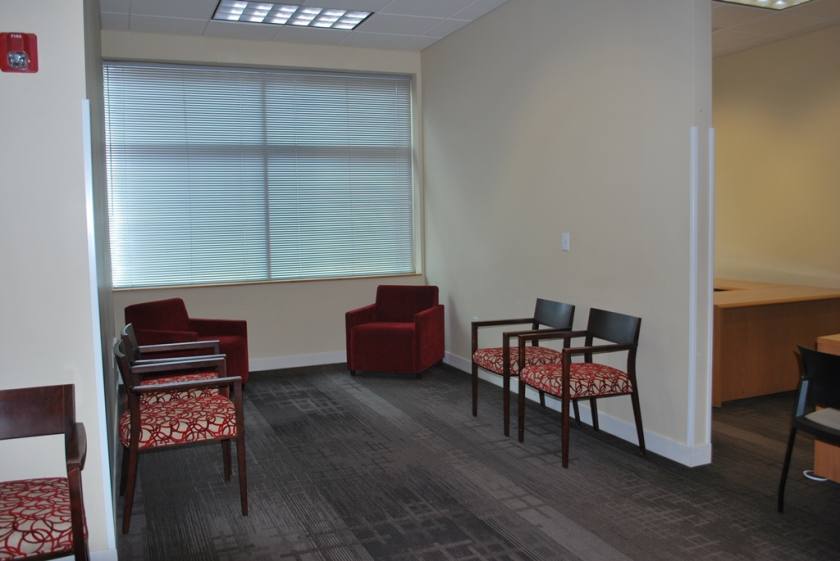
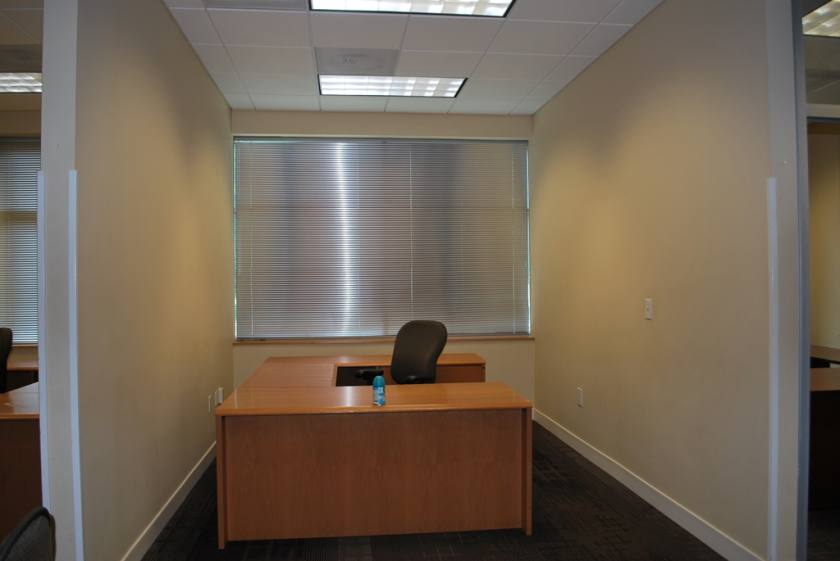
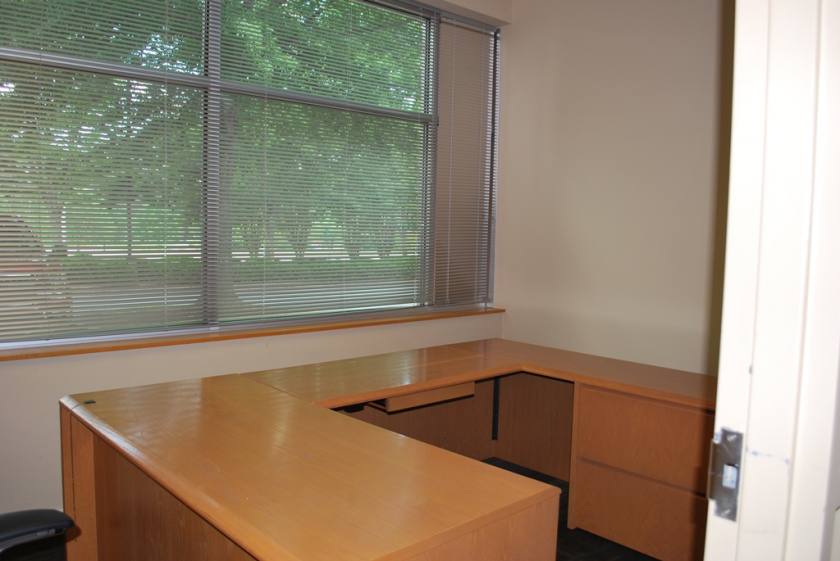
Additional Photos

Listing Agents

Brent Randolph
O: 770-318-6815
brandolph@rwcre.net
O: 770-318-6815
brandolph@rwcre.net
While we strive to provide the most accurate information, all listing information, and demographic data, is provided by third-parties. As such, MyEListing will not be responsible for the accuracy of the information. It is strongly recommended that you verify all information with the listing agent, and any relevant agencies, prior to making any decisions.