Office Space
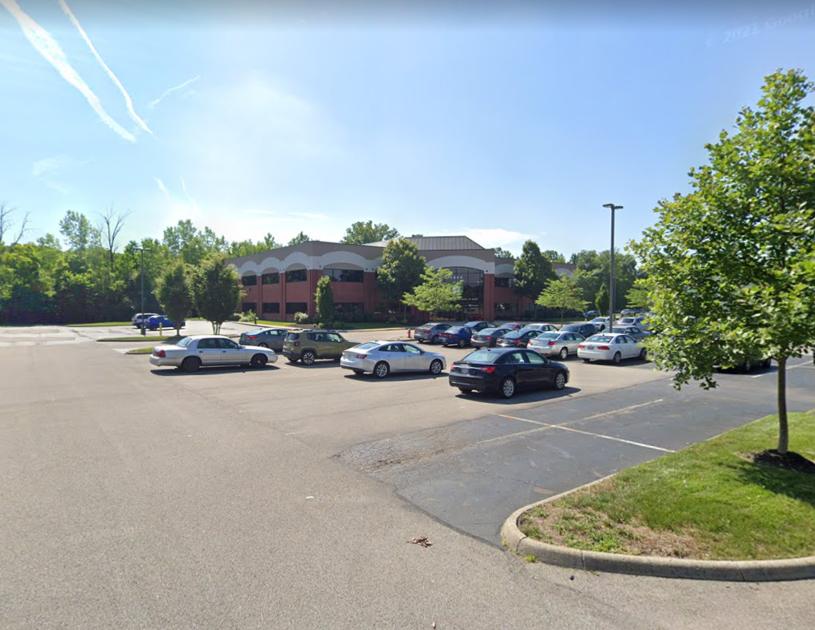
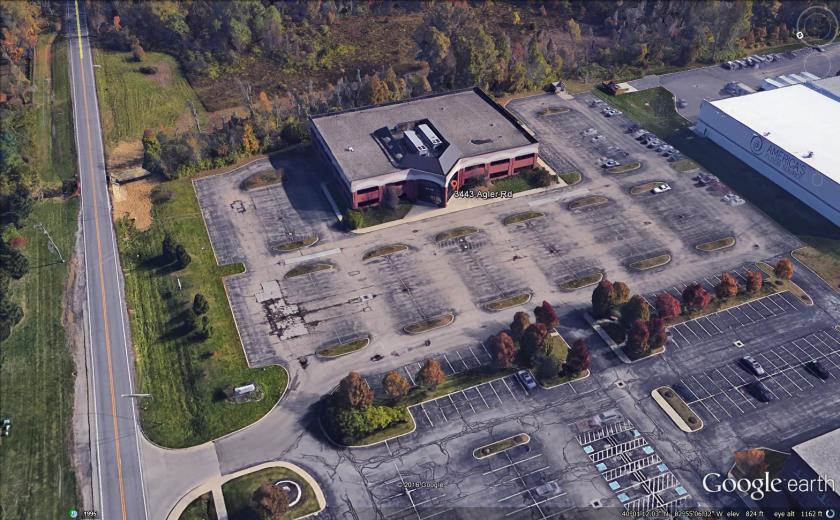
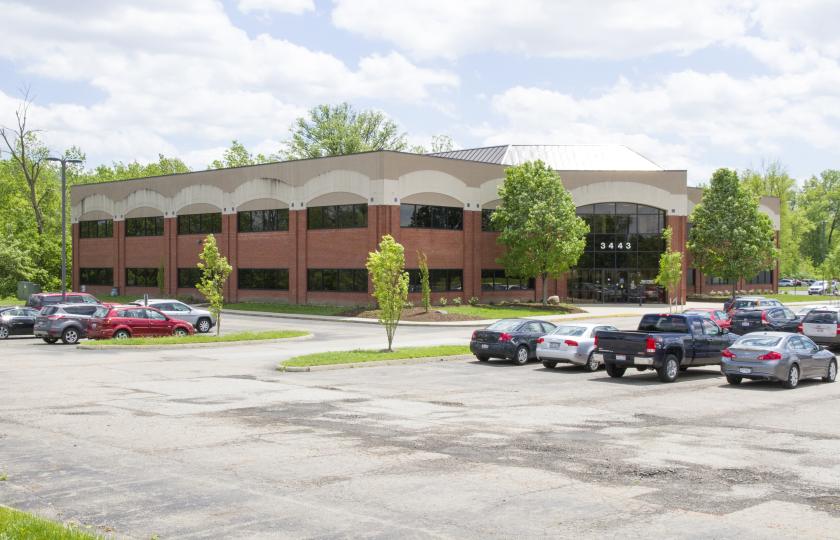
3443 Agler Road Columbus, OH 43219
3443 Agler Road Columbus, OH 43219

Details & Description
Property Highlights
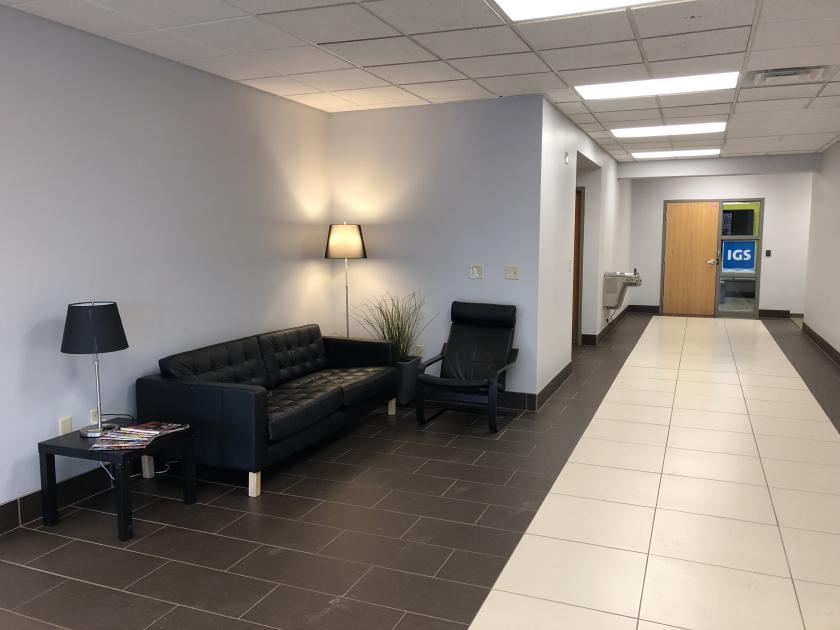
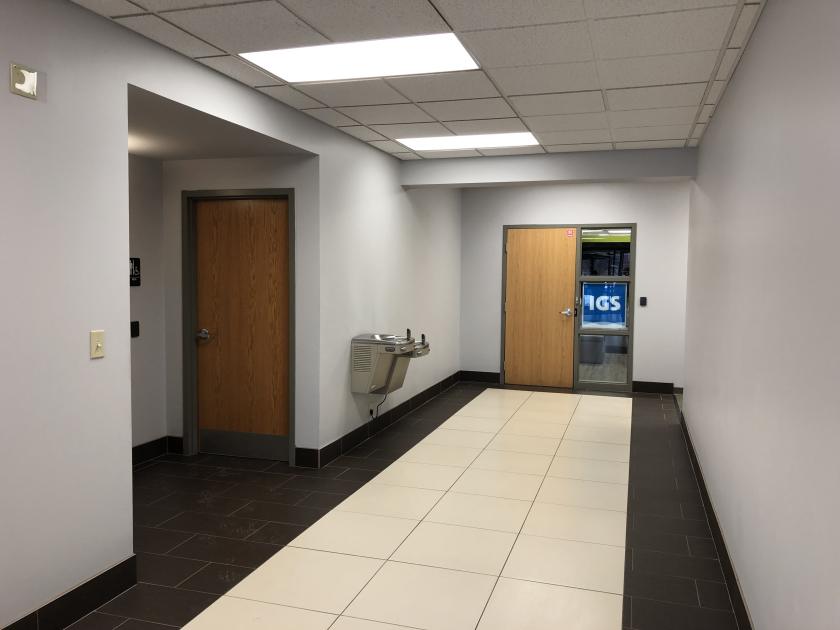
• 3,376 +/- SF office space on the 1st floor available
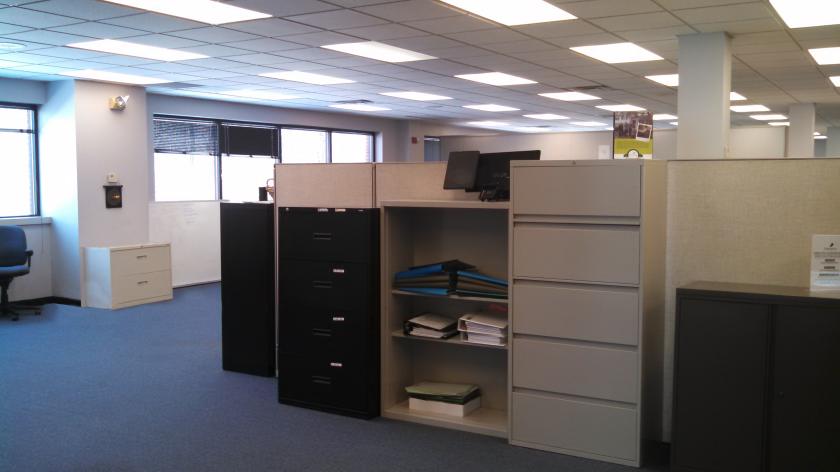
• 4,439 +/- SF office space on the 2nd floor available
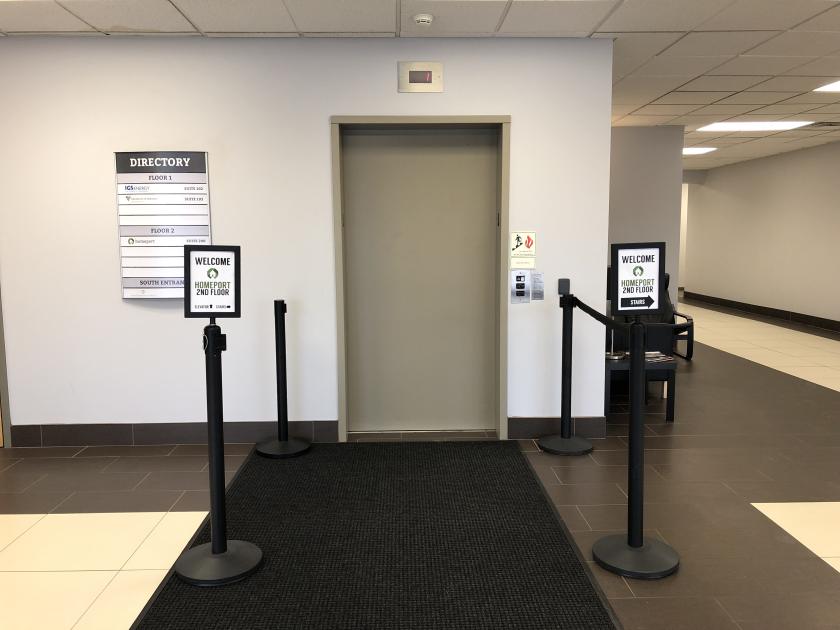
Additional Photos


Listing Agents

Ty Patillo
M: 440-339-6001
tpatillo@rweiler.com
M: 440-339-6001
tpatillo@rweiler.com

Mike Doss
M: 614-915-2624
mdoss@rweiler.com
M: 614-915-2624
mdoss@rweiler.com
While we strive to provide the most accurate information, all listing information, and demographic data, is provided by third-parties. As such, MyEListing will not be responsible for the accuracy of the information. It is strongly recommended that you verify all information with the listing agent, and any relevant agencies, prior to making any decisions.