Specialty Real Estate
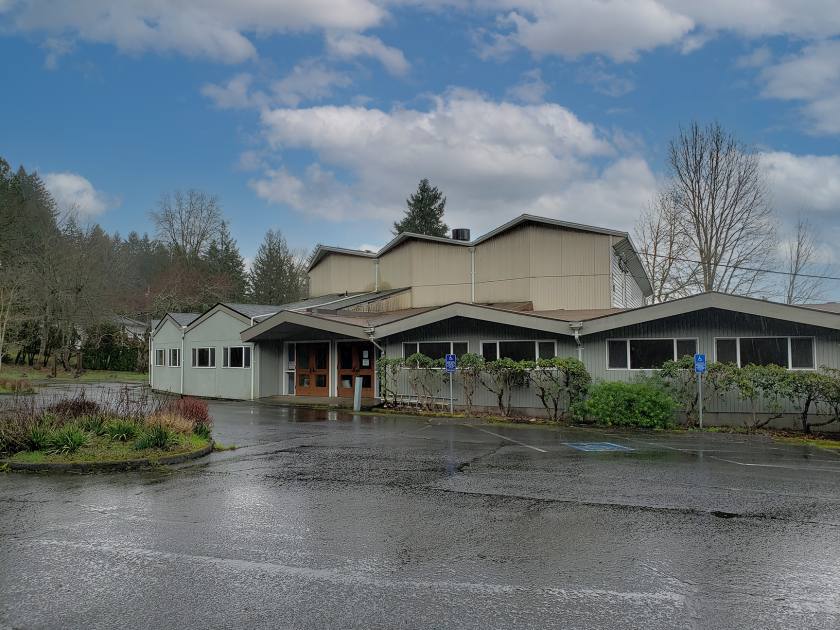
9750 Southwest Terwilliger Boulevard Portland, OR 97219
9750 Southwest Terwilliger Boulevard Portland, OR 97219
Details & Description
Listing Agents

Bob Lefeber
O: 503-595-7569
M: 503-807-4174
bob@cra-nw.com
O: 503-595-7569
M: 503-807-4174
bob@cra-nw.com
While we strive to provide the most accurate information, all listing information, and demographic data, is provided by third-parties. As such, MyEListing will not be responsible for the accuracy of the information. It is strongly recommended that you verify all information with the listing agent, and any relevant agencies, prior to making any decisions.


