Flex-Office-Warehouse
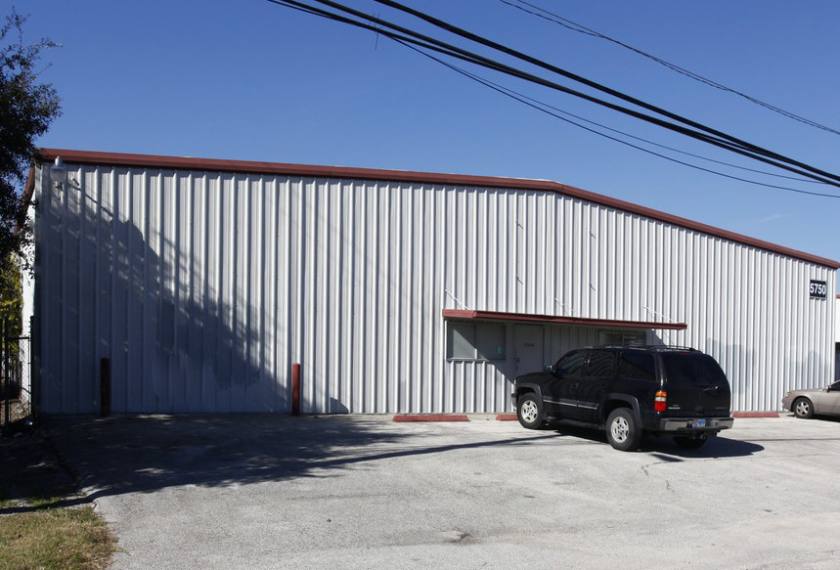
5750 Royalton Street Houston, TX 77081
5750 Royalton Street Houston, TX 77081
Details & Description
Property Highlights
• Easy access from I-69Hwy 59 Southwest Freeway and IH-610 Loop
• 14 tall service doors, grade level
Listing Agents

Gary Triplett
O: 713-961-9777
gtriplett@cmirealestate.com
O: 713-961-9777
gtriplett@cmirealestate.com
While we strive to provide the most accurate information, all listing information, and demographic data, is provided by third-parties. As such, MyEListing will not be responsible for the accuracy of the information. It is strongly recommended that you verify all information with the listing agent, and any relevant agencies, prior to making any decisions.