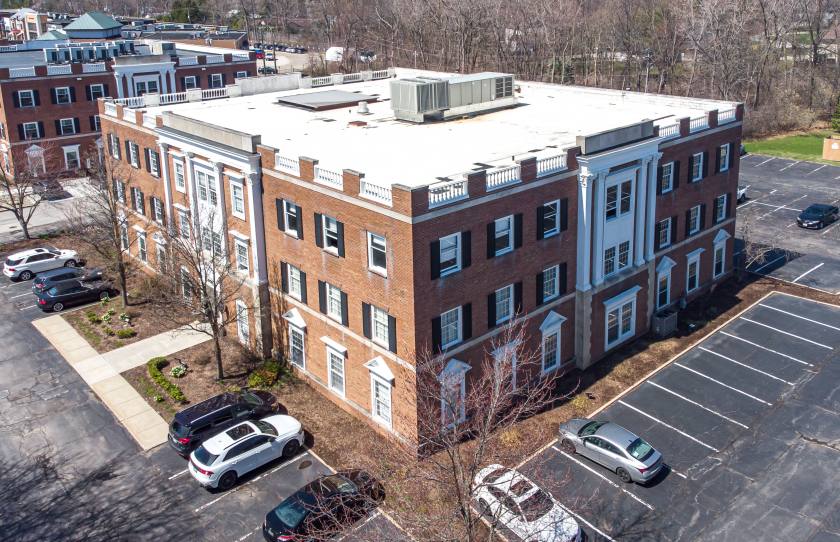
Office Space
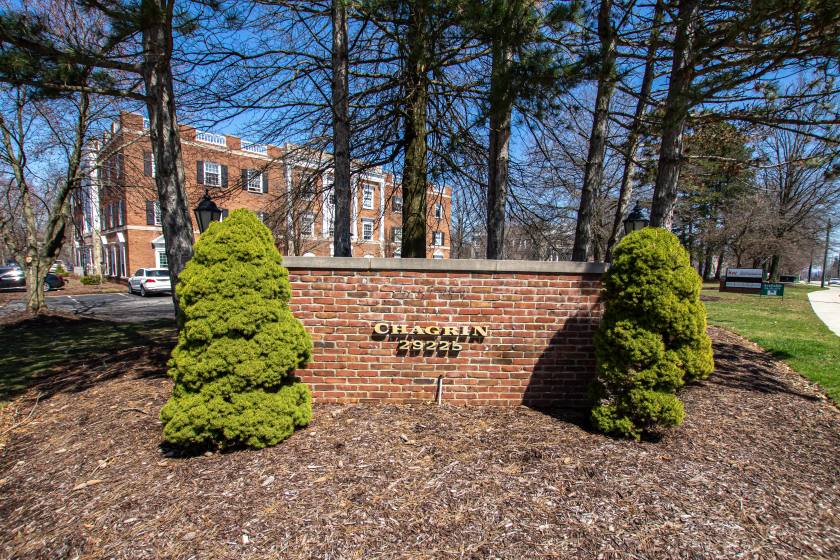
29225 Chagrin Boulevard Beachwood, OH 44122
29225 Chagrin Boulevard Beachwood, OH 44122
Details & Description
Property Highlights
- • Natural Light
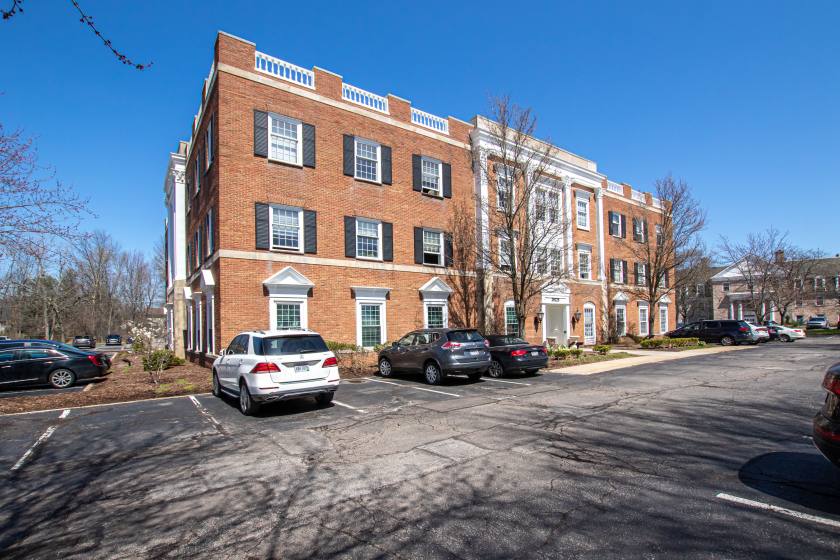
- • Plenty of Parking
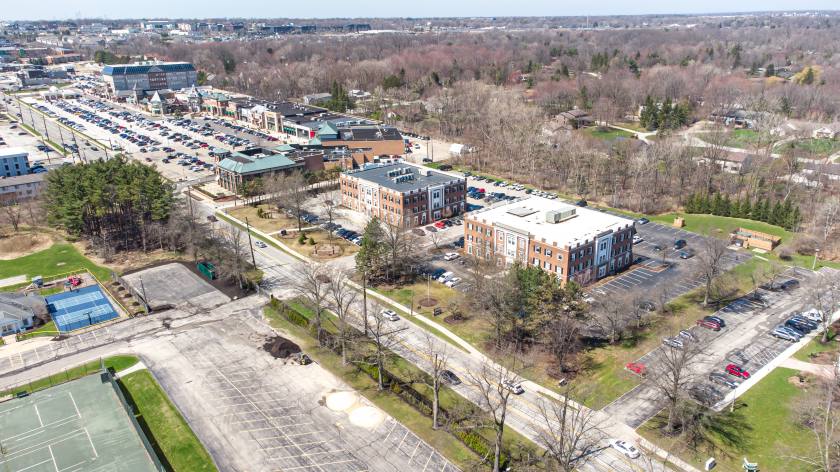
- • High Net Worth Trade Area
- • Convenient Shopping
- • Quality Tenant Mix
- • Updated Common Areas
Additional Photos

Listing Agents

Eric Purcell
O: 216-245-3343
M: 216-702-4066
eric@citiroc.com
O: 216-245-3343
M: 216-702-4066
eric@citiroc.com
While we strive to provide the most accurate information, all listing information, and demographic data, is provided by third-parties. As such, MyEListing will not be responsible for the accuracy of the information. It is strongly recommended that you verify all information with the listing agent, and any relevant agencies, prior to making any decisions.


