Office Space
1704 South Custer Road Monroe, MI 48161
1704 South Custer Road Monroe, MI 48161

Details & Description
Property Highlights
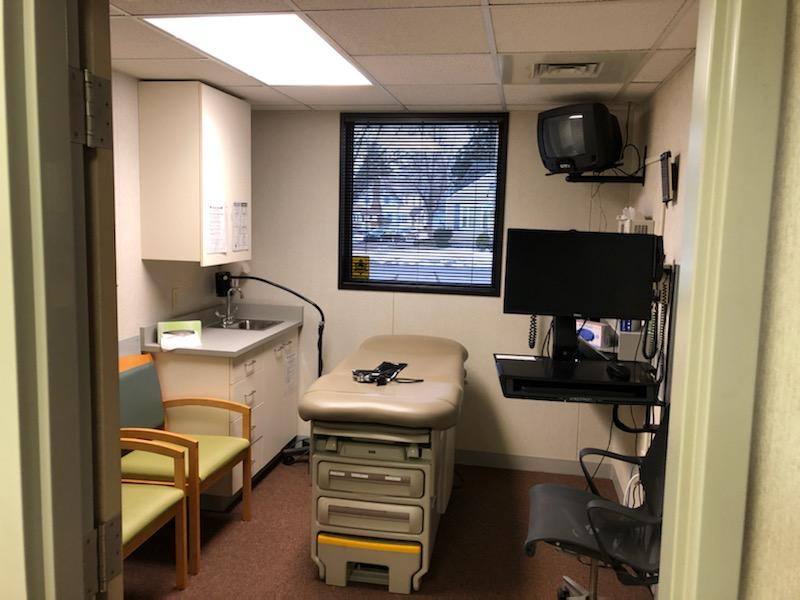
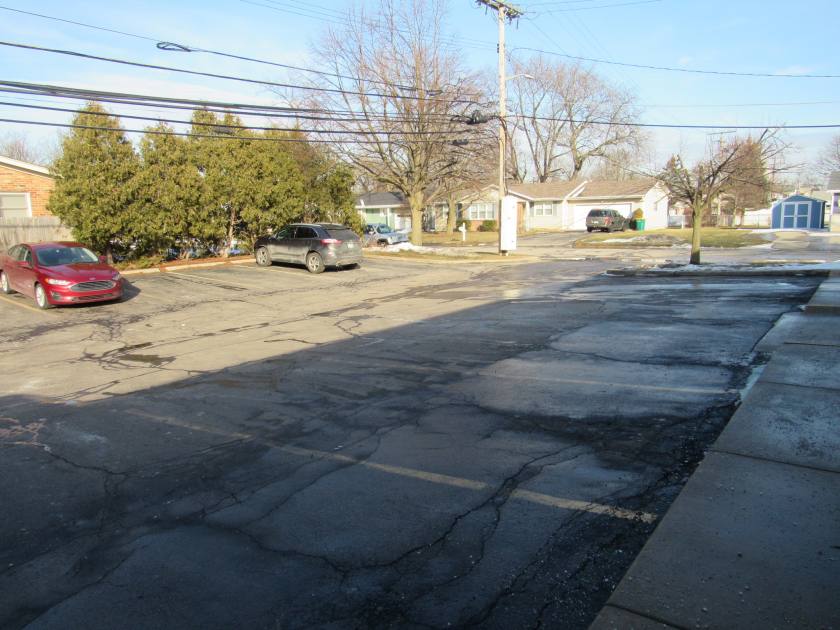
- • Medical Investment Property
- • Perfect for all investors
- • Two long term tenants
Additional Photos


Listing Agents

Steven Lennex
O: 734-856-6464
M: 419-356-8745
slennex@lennexrc.com
O: 734-856-6464
M: 419-356-8745
slennex@lennexrc.com
While we strive to provide the most accurate information, all listing information, and demographic data, is provided by third-parties. As such, MyEListing will not be responsible for the accuracy of the information. It is strongly recommended that you verify all information with the listing agent, and any relevant agencies, prior to making any decisions.