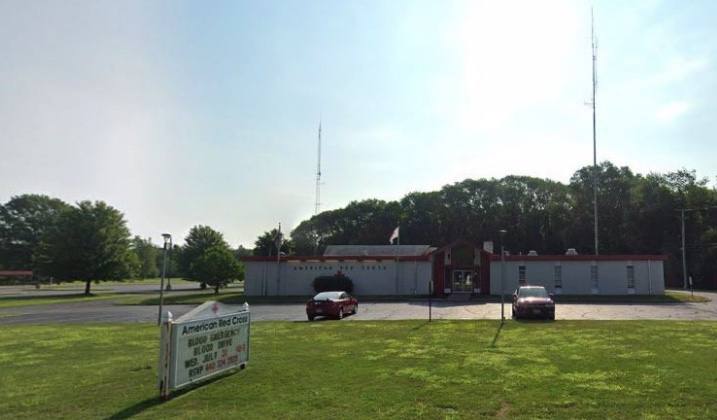
Specialty Real Estate
2929 West River Road North Elyria, OH 44035
2929 West River Road North Elyria, OH 44035
Details & Description
Property Highlights
- • Great visibility and signage opportunities
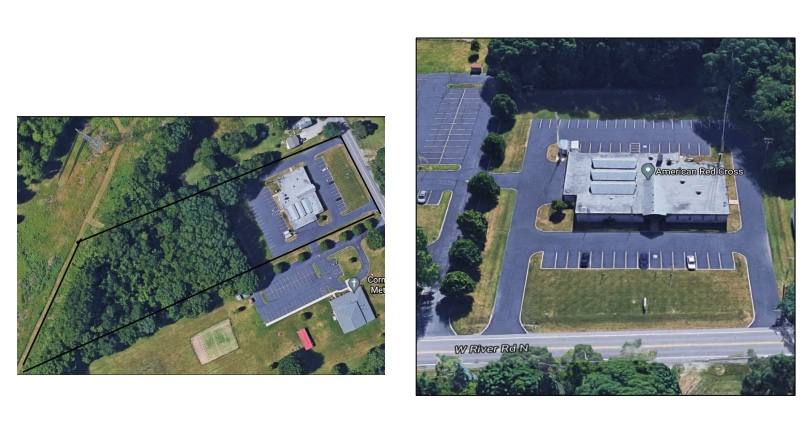
- • Ample surface parking
- • Over 4 acres of land
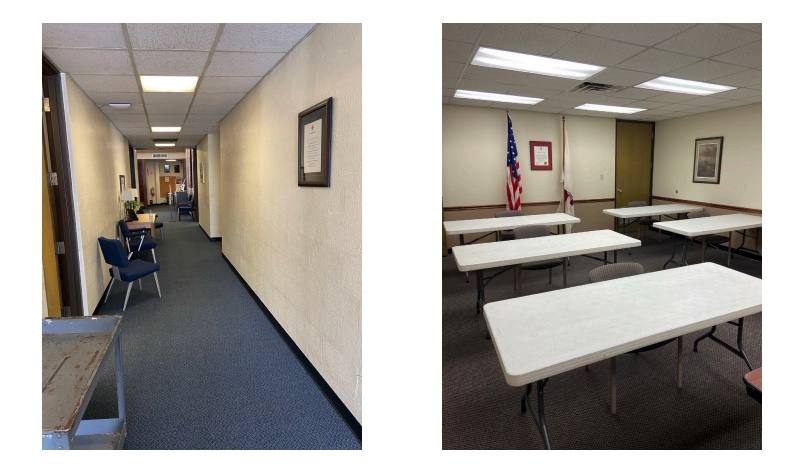
- • Uses could be multi-purpose
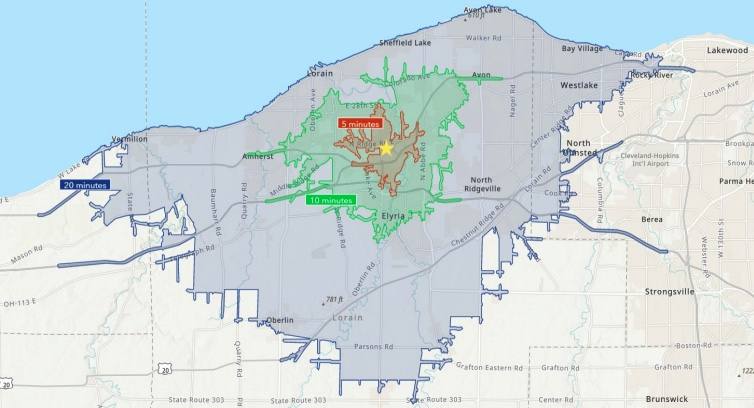
- • Easily accessible from I-90 and State Route 57
- • Minutes away from multiple amenities
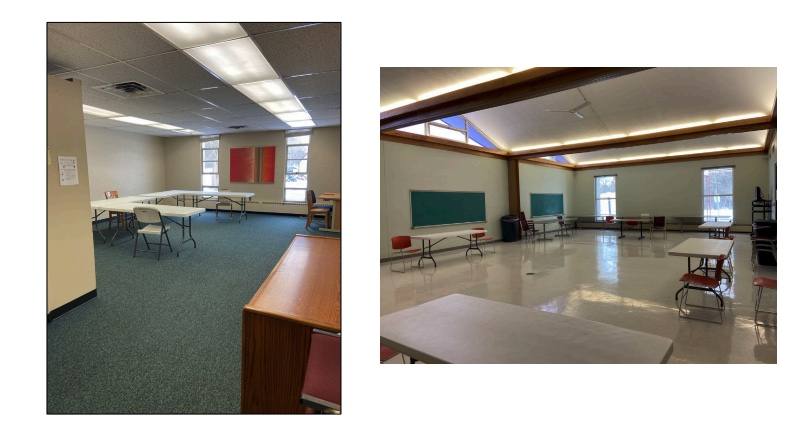
Additional Photos
Listing Agents

Warren Blazy III
O: 216-937-4372
warren.blazy@am.jll.com
O: 216-937-4372
warren.blazy@am.jll.com

Eric Smith
JLL
O: 216-937-4391
eric.smith@am.jll.com
JLL
O: 216-937-4391
eric.smith@am.jll.com
While we strive to provide the most accurate information, all listing information, and demographic data, is provided by third-parties. As such, MyEListing will not be responsible for the accuracy of the information. It is strongly recommended that you verify all information with the listing agent, and any relevant agencies, prior to making any decisions.


