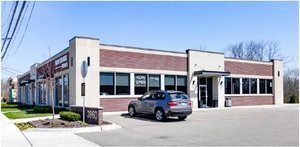
1-Mile | 3-Miles | 5-Miles | ||
---|---|---|---|---|
Total Population | 15,587 | 126,048 | 329,106 | |
Population Median Age | 39 | 40 | 40 | |
Population by Age | 0-9 Yrs | 1668 (10%) | 12604 (9%) | 33958 (10%) |
10-19 Yrs | 1624 (10%) | 11420 (9%) | 32919 (10%) | |
20-29 Yrs | 2372 (15%) | 21708 (17%) | 54325 (16%) | |
30-39 Yrs | 2563 (16%) | 20236 (16%) | 52025 (15%) | |
40-49 Yrs | 1948 (12%) | 15222 (12%) | 40825 (12%) | |
50-59 Yrs | 2609 (16%) | 17804 (14%) | 44013 (13%) | |
60-69 Yrs | 1417 (9%) | 13845 (10%) | 38019 (11%) | |
70+ Yrs | 1386 (8%) | 13208 (10%) | 33022 (10%) | |
Median HH Income | $61,806 | $64,524 | $60,963 | |
Total Household Income | < 24K | 1086 (16%) | 10559 (18%) | 28323 (19%) |
25-49K | 1412 (21%) | 11252 (20%) | 30804 (21%) | |
50-74K | 1463 (22%) | 10518 (18%) | 25940 (18%) | |
75-99K | 1132 (17%) | 8095 (14%) | 19947 (14%) | |
100-199K | 1395 (21%) | 12744 (22%) | 30435 (21%) | |
200K+ | 86 (1%) | 2953 (5%) | 6728 (4%) | |
Highest Education Level | No Diploma | 995 | 8854 | 23270 |
Diploma or GED | 3726 | 24015 | 59503 | |
Some College | 2802 | 18837 | 50245 | |
Assoc. Degree | 960 | 7623 | 20051 | |
Bachelors Degree | 1919 | 21743 | 53747 | |
Higher Degree | 967 | 12662 | 33002 | |
Total Housing Units | 6,868 | 60,248 | 155,279 | |
--Owner-Occupied | 4,691 | 36,980 | 91,902 | |
--Renter-Occupied | 1,882 | 19,142 | 50,275 | |
Owner-Occupied Values | < 100K | 1154 | 7286 | 21928 |
100-199K | 3132 | 17961 | 40395 | |
200-299K | 320 | 7375 | 18830 | |
300-399K | 42 | 2272 | 6207 | |
400-499K | 20 | 936 | 2118 | |
500K+ | 22 | 1149 | 2424 | |
Total Working Age Population | 12,973 | 106,490 | 275,186 | |
In Work Force | 9,203 | 72,832 | 182,979 | |
Not In Work Force | 3,770 | 33,658 | 92,207 | |
Workforce Employed | 8,756 | 69,635 | 173,417 | |
Workforce Unemployed | 446 | 3,124 | 9,429 | |
Civlian Workforce | 9,203 | 72,759 | 182,846 | |
Military Workforce | 0 | 73 | 134 | |
Total Households | 6,573 | 56,122 | 142,177 | |
Family Households | 3,748 | 29,720 | 77,808 | |
Non-Family Households | 2,825 | 26,403 | 64,369 | |
Married Couple | 2,713 | 22,212 | 54,989 | |
Other Family | 1,035 | 7,508 | 22,819 | |
Married w/Child | 989 | 8,196 | 21,501 | |
Single Male w/Child | 162 | 882 | 2,459 | |
Single Female w/Child | 314 | 2,070 | 6,593 |
Population Change Last Two Decades - Plus Projection
2000 | % | 2010 | % | 2020 | % | 2030 | |
---|---|---|---|---|---|---|---|
Michigan | 9,938,444 | -1 | 9,883,640 | +1 | 10,023,423 | +4 | 10,424,510 |
Macomb County | 788,149 | +7 | 840,978 | +5 | 883,020 | +6 | 933,965 |
Oakland County | 1,194,156 | +1 | 1,202,362 | +5 | 1,264,515 | +7 | 1,350,052 |
Wayne County | 2,061,162 | -12 | 1,820,584 | -4 | 1,741,463 | -1 | 1,730,000 |
Total Working Age Population:
Total Households:
Total Working Age Population:
Total Households:
Total Working Age Population:
Total Households: