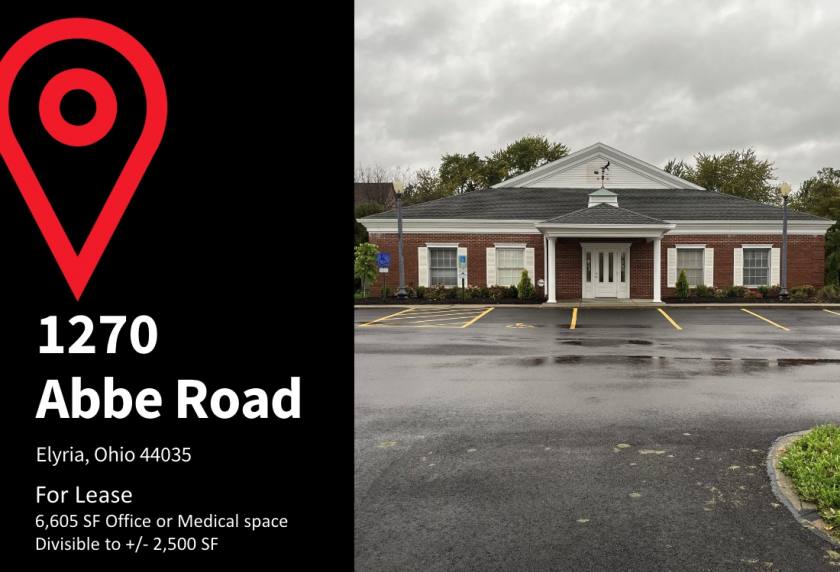
Office Space
1270 Abbe Road North Elyria, OH 44035
1270 Abbe Road North Elyria, OH 44035
Details & Description
Property Highlights
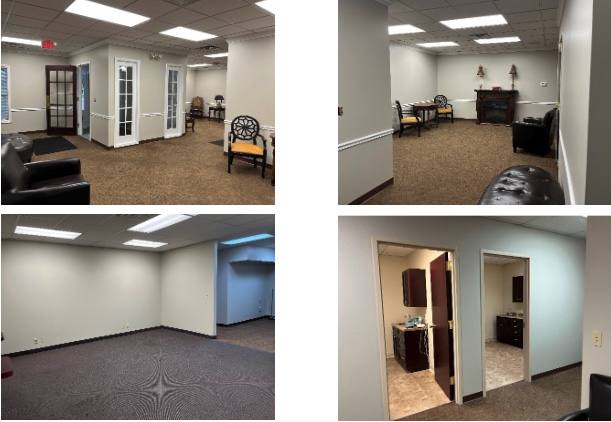
- • Layout ideal for office or medical user
- • Move-In ready exam rooms for medical usage
- • Negotiable lease rates
- • Great signage opportunities
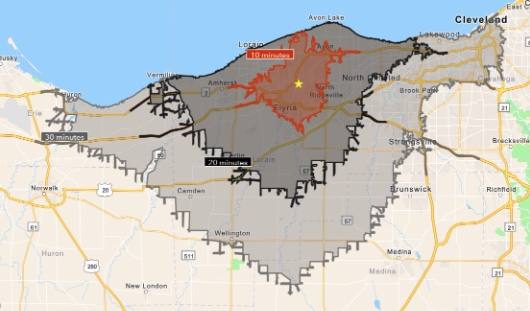
- • Easily accessible from both I-90 and I-80
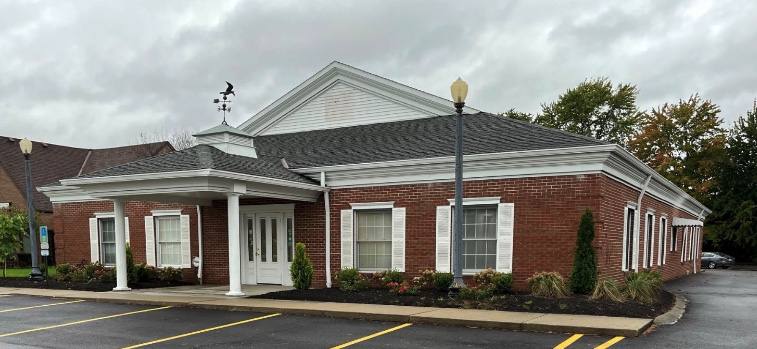
Additional Photos

Listing Agents

Warren Blazy III
O: 216-937-4372
warren.blazy@am.jll.com
O: 216-937-4372
warren.blazy@am.jll.com

Eric Smith
JLL
O: 216-937-4391
eric.smith@am.jll.com
JLL
O: 216-937-4391
eric.smith@am.jll.com
While we strive to provide the most accurate information, all listing information, and demographic data, is provided by third-parties. As such, MyEListing will not be responsible for the accuracy of the information. It is strongly recommended that you verify all information with the listing agent, and any relevant agencies, prior to making any decisions.


