Office Space
300 Village Green Circle Southeast Smyrna, GA 30080
300 Village Green Circle Southeast Smyrna, GA 30080
Details & Description
Property Highlights
- • Air Conditioning System
- • Heating System
- • Newly Painted
- • Located in the Village Pavilion
- • Great Location
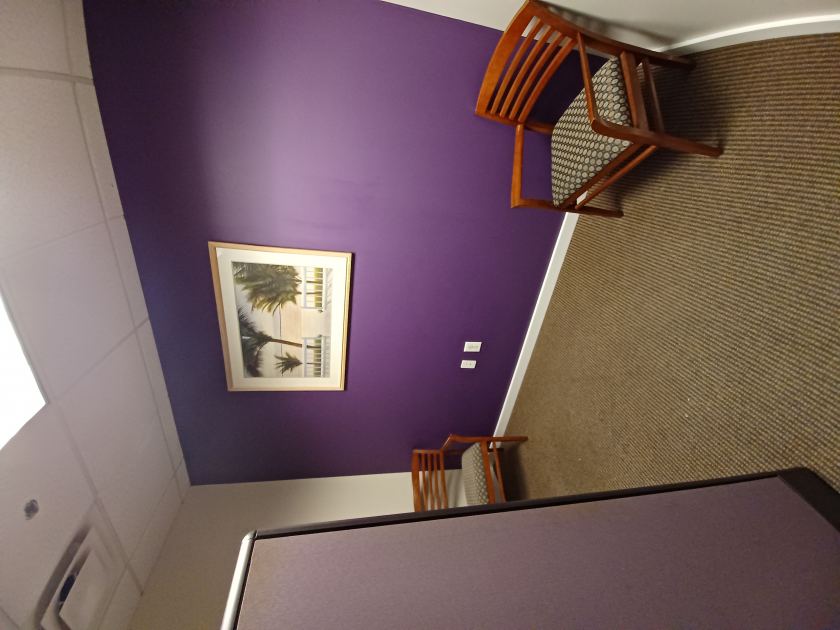
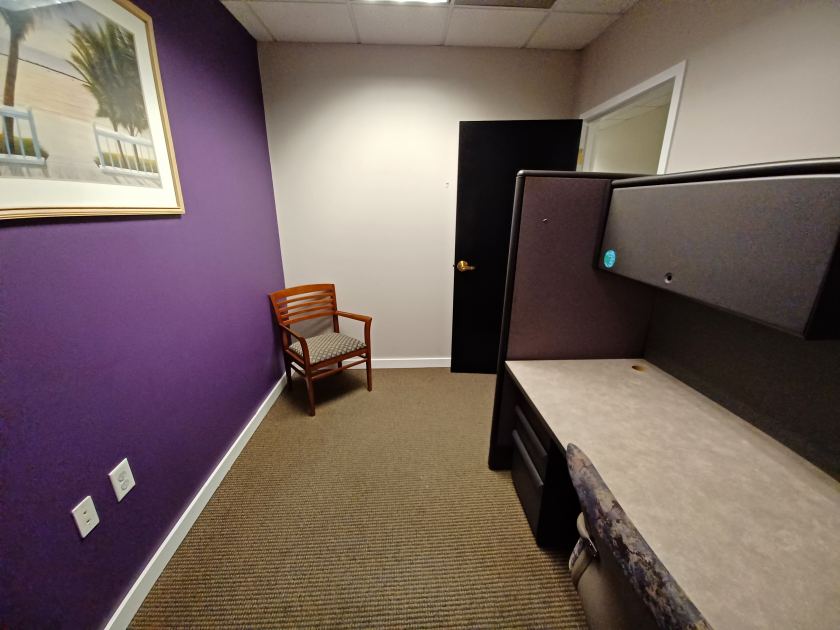
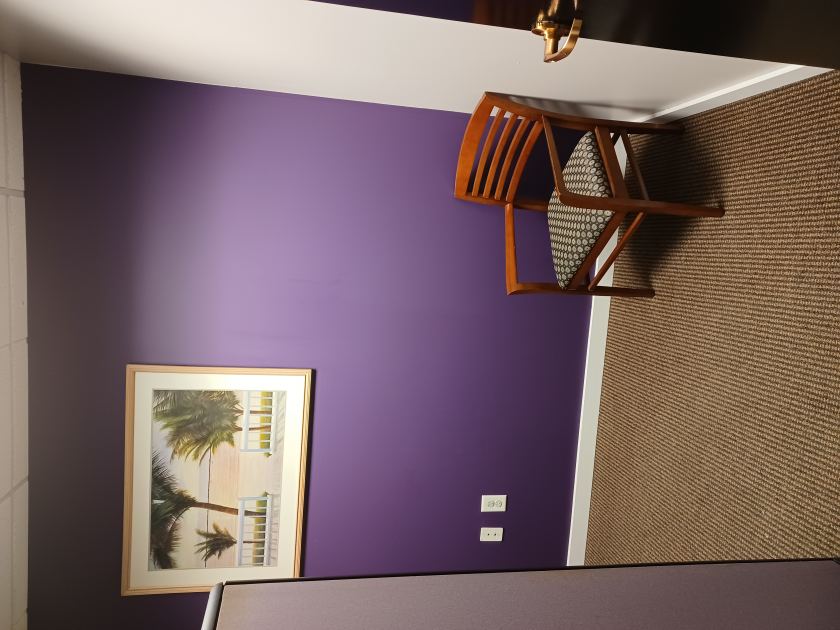
- • Fully Furnished
Additional Photos


Listing Agents

Phyllis JonesGraham
pjs.pama@gmail.com
pjs.pama@gmail.com
While we strive to provide the most accurate information, all listing information, and demographic data, is provided by third-parties. As such, MyEListing will not be responsible for the accuracy of the information. It is strongly recommended that you verify all information with the listing agent, and any relevant agencies, prior to making any decisions.