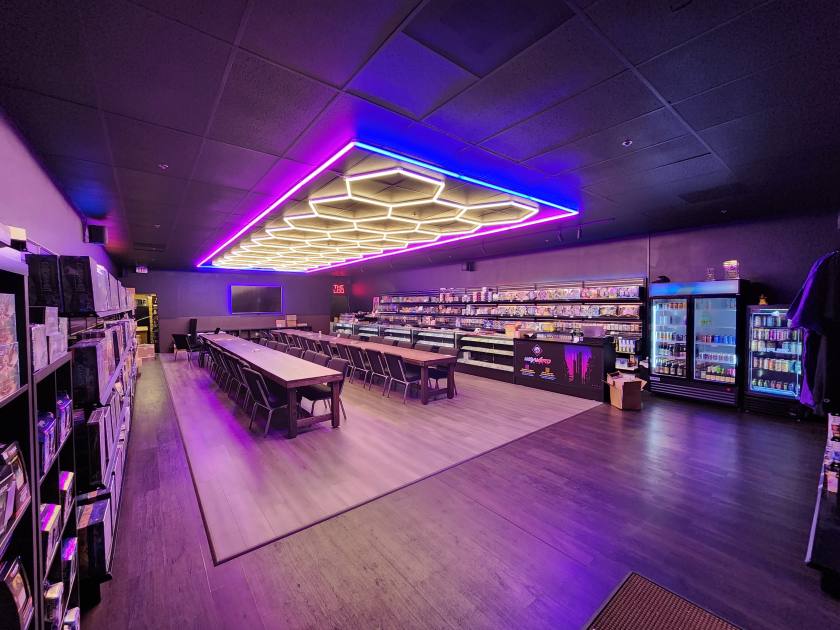
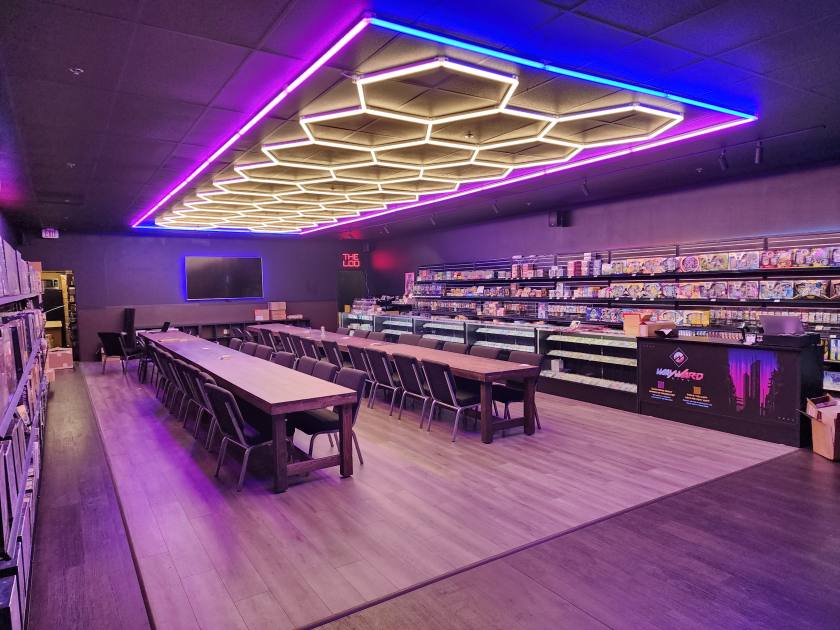
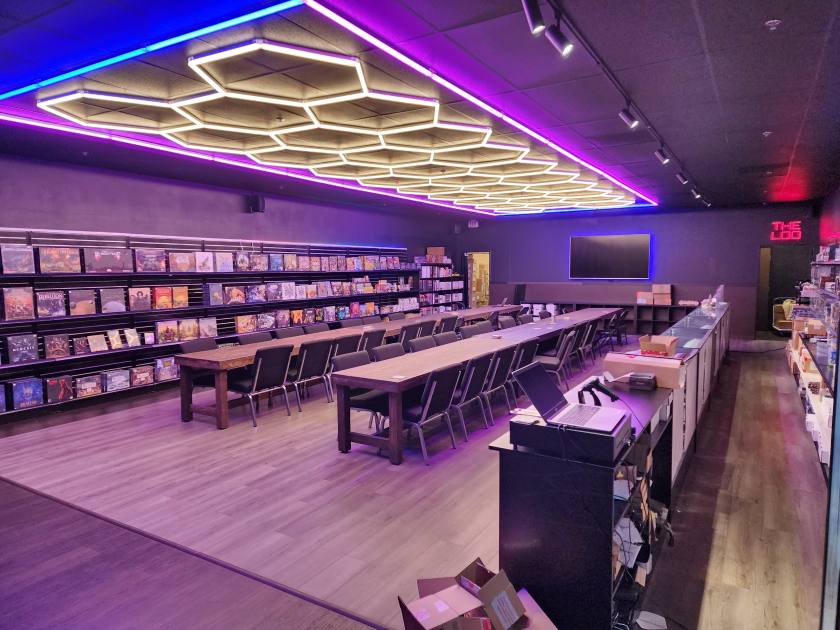
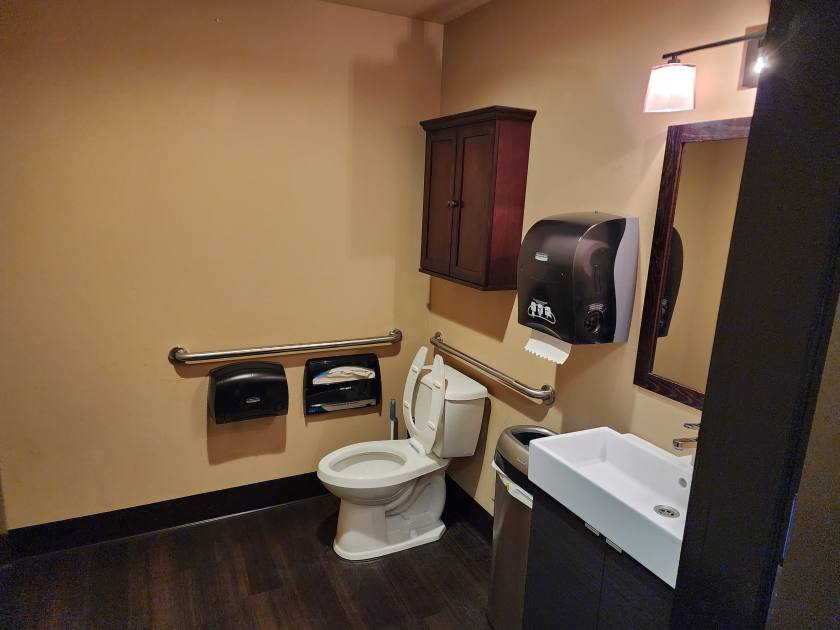
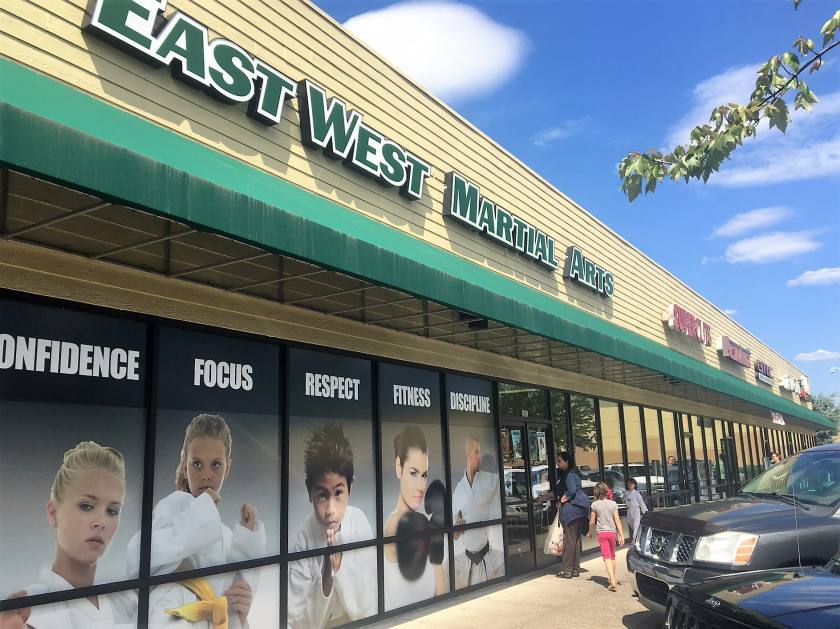
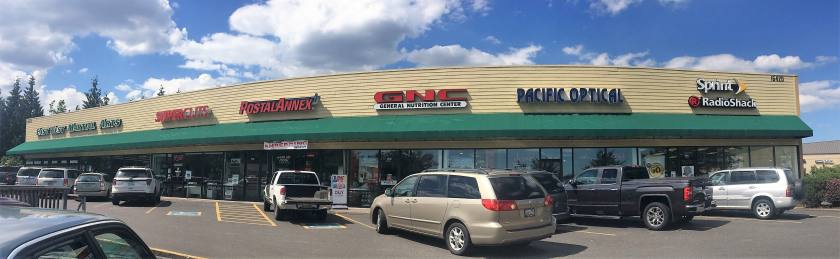
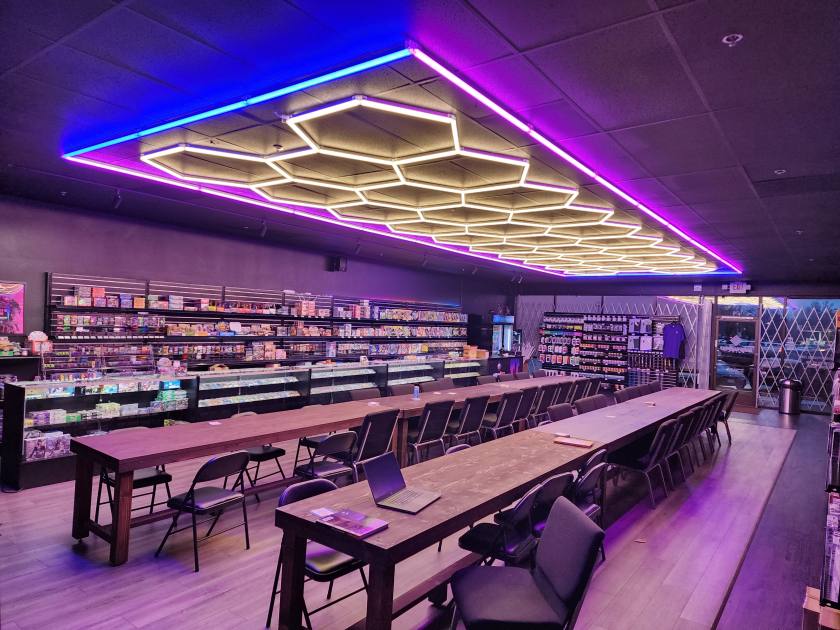
Retail Space
16420 Southeast McGillivray Boulevard Vancouver, WA 98683
16420 Southeast McGillivray Boulevard Vancouver, WA 98683
Details & Description
Property Highlights
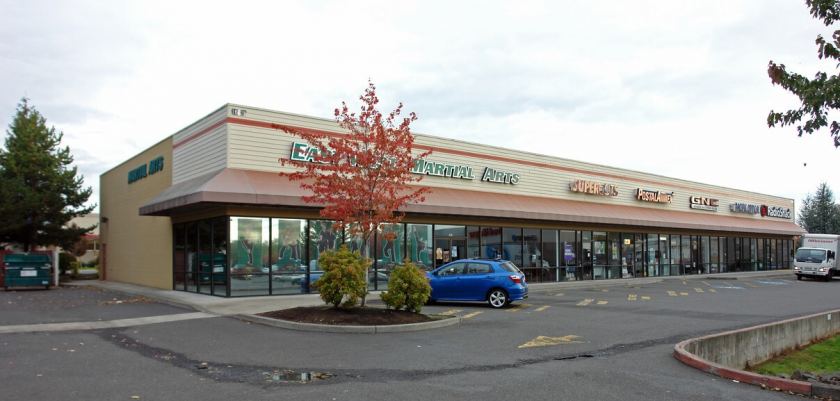
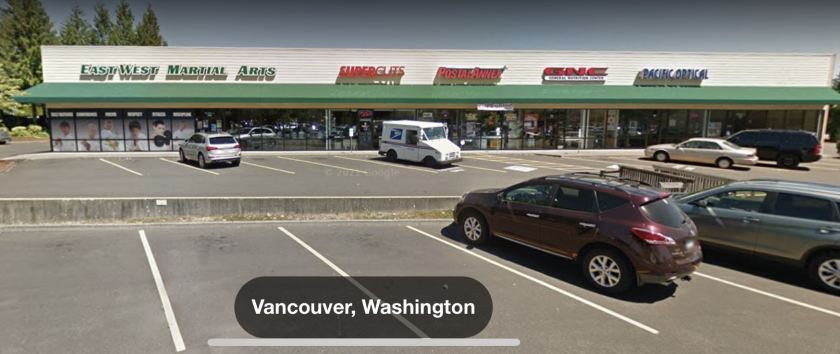
- • Large Parking Lot
- • Busy Shopping Center
- • Near Fred Meyer and Walgreens
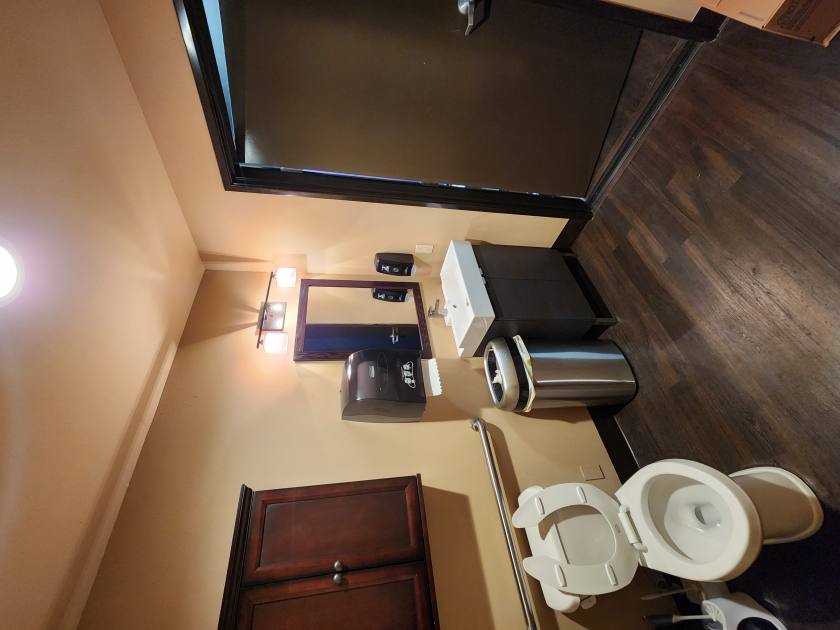
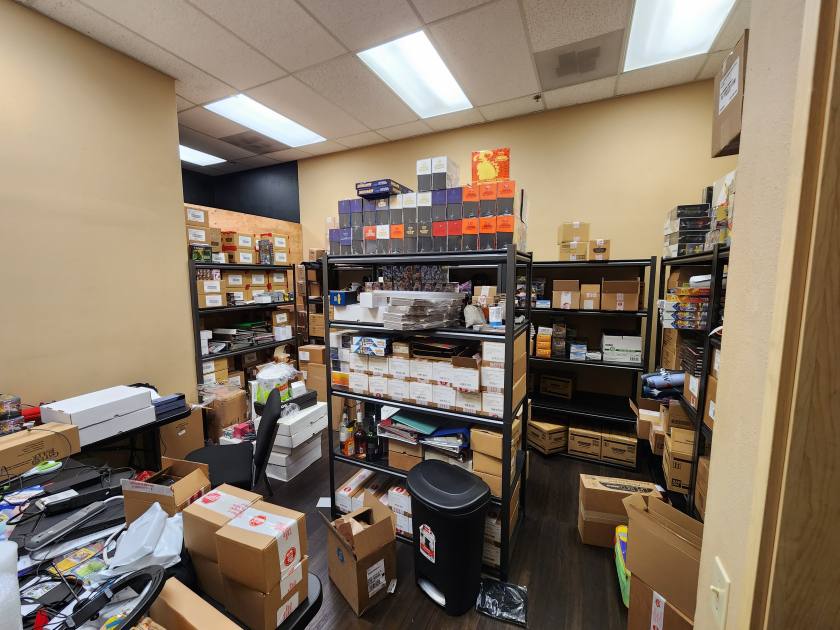
Additional Photos
Listing Agents

Cari Jones
O: 360-694-1031
carijones.tpg@gmail.com
O: 360-694-1031
carijones.tpg@gmail.com
While we strive to provide the most accurate information, all listing information, and demographic data, is provided by third-parties. As such, MyEListing will not be responsible for the accuracy of the information. It is strongly recommended that you verify all information with the listing agent, and any relevant agencies, prior to making any decisions.