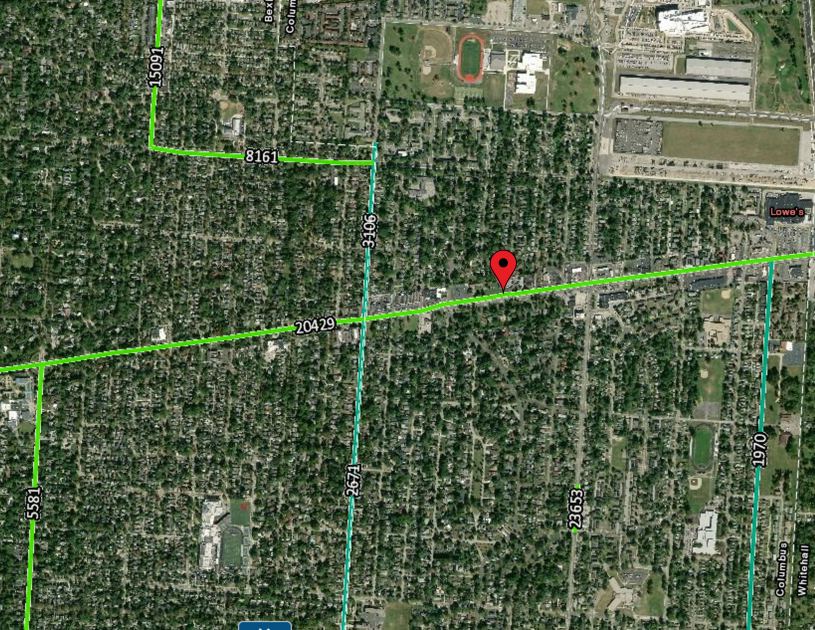
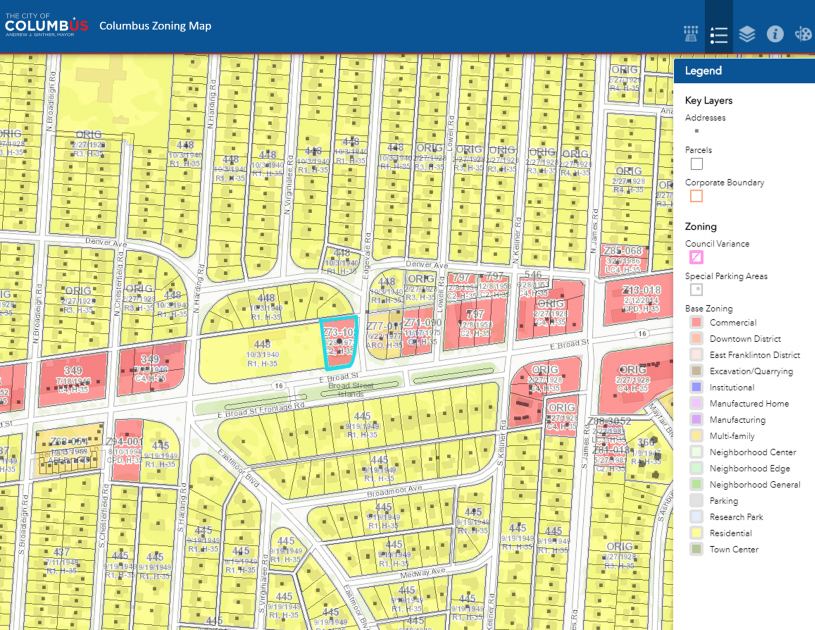
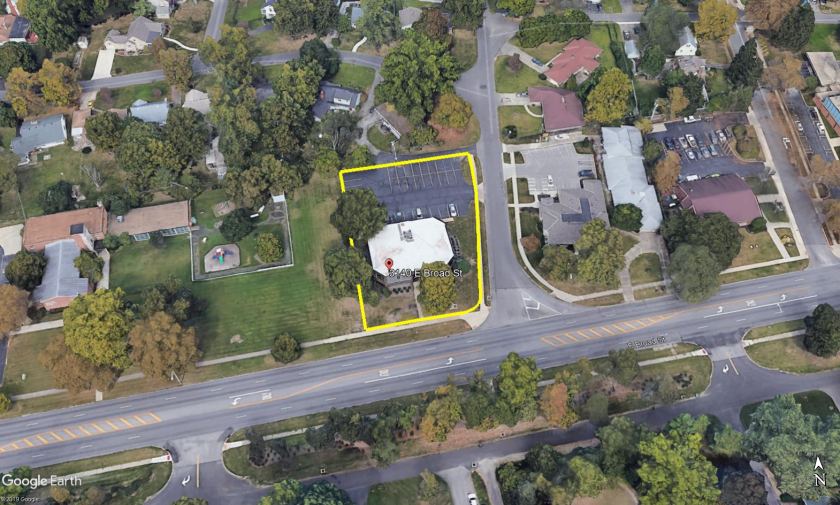
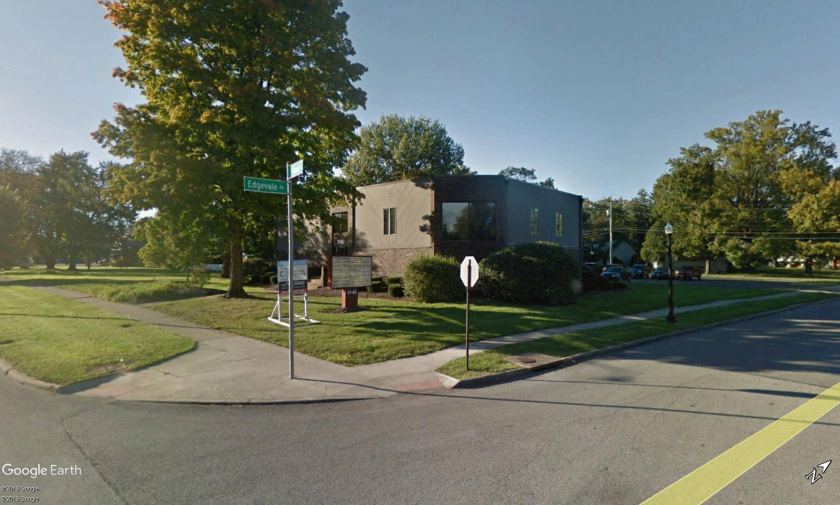
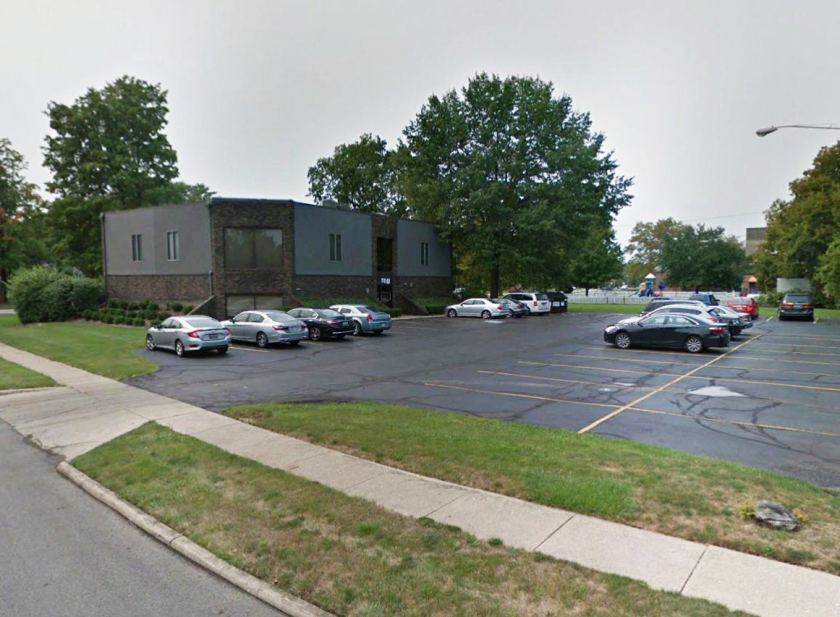
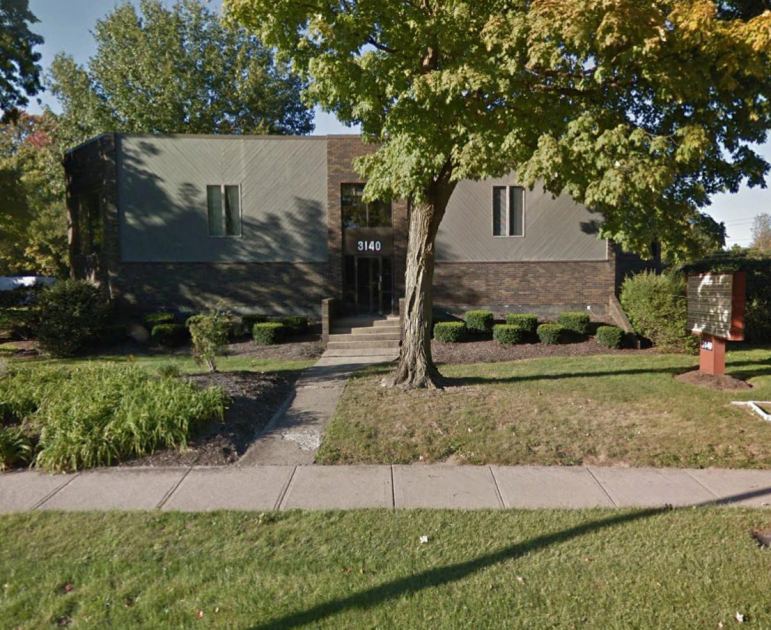
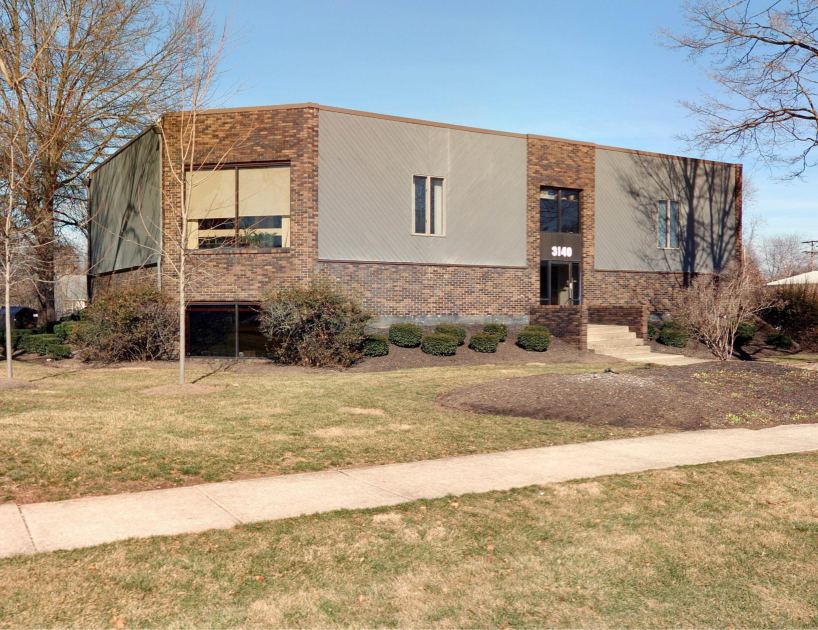
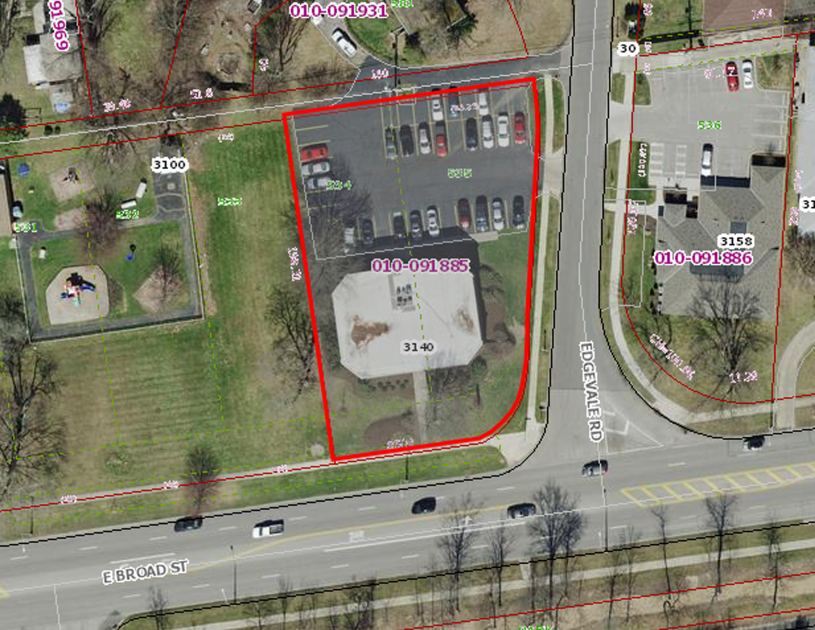
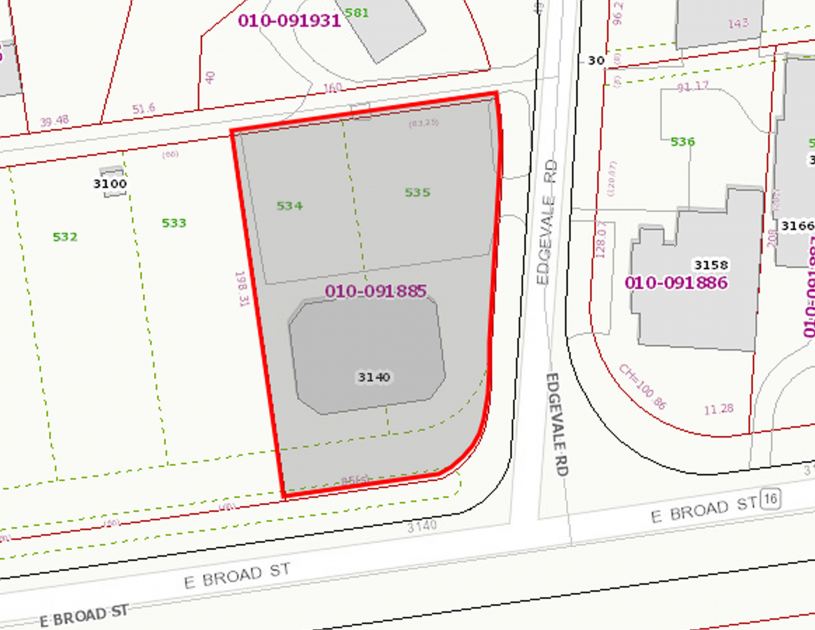
1-Mile | 3-Miles | 5-Miles | ||
---|---|---|---|---|
Total Population | 15,554 | 102,599 | 292,271 | |
Population Median Age | 35 | 36 | 36 | |
Population by Age | 0-9 Yrs | 2681 (17%) | 15302 (14%) | 41654 (14%) |
10-19 Yrs | 1929 (12%) | 13295 (12%) | 34348 (11%) | |
20-29 Yrs | 2365 (15%) | 15413 (15%) | 55414 (18%) | |
30-39 Yrs | 2193 (14%) | 14798 (14%) | 43723 (14%) | |
40-49 Yrs | 1736 (11%) | 11399 (11%) | 32880 (11%) | |
50-59 Yrs | 1950 (12%) | 12607 (12%) | 34149 (11%) | |
60-69 Yrs | 1453 (9%) | 11122 (10%) | 27911 (9%) | |
70+ Yrs | 1248 (8%) | 8662 (8%) | 22192 (7%) | |
Median HH Income | $44,717 | $41,678 | $43,399 | |
Total Household Income | < 24K | 1824 (28%) | 12306 (29%) | 35041 (29%) |
25-49K | 1593 (24%) | 11590 (28%) | 31997 (26%) | |
50-74K | 856 (13%) | 6921 (16%) | 20641 (17%) | |
75-99K | 586 (9%) | 3808 (9%) | 13002 (10%) | |
100-199K | 1074 (16%) | 4983 (12%) | 16026 (13%) | |
200K+ | 490 (7%) | 1742 (4%) | 4024 (3%) | |
Highest Education Level | No Diploma | 782 | 8340 | 23494 |
Diploma or GED | 2283 | 20579 | 56426 | |
Some College | 2125 | 15177 | 41545 | |
Assoc. Degree | 564 | 4608 | 12785 | |
Bachelors Degree | 2064 | 11035 | 36149 | |
Higher Degree | 2198 | 7984 | 21349 | |
Total Housing Units | 7,037 | 47,893 | 137,213 | |
--Owner-Occupied | 2,909 | 19,045 | 50,634 | |
--Renter-Occupied | 3,514 | 22,306 | 70,098 | |
Owner-Occupied Values | < 100K | 525 | 8213 | 19777 |
100-199K | 574 | 5108 | 16109 | |
200-299K | 485 | 2449 | 8099 | |
300-399K | 534 | 1179 | 2768 | |
400-499K | 415 | 753 | 1449 | |
500K+ | 376 | 1342 | 2431 | |
Total Working Age Population | 11,567 | 79,460 | 230,274 | |
In Work Force | 8,382 | 52,385 | 156,809 | |
Not In Work Force | 3,185 | 27,075 | 73,465 | |
Workforce Employed | 7,726 | 47,851 | 144,303 | |
Workforce Unemployed | 655 | 4,520 | 12,396 | |
Civlian Workforce | 8,382 | 52,371 | 156,699 | |
Military Workforce | 0 | 13 | 110 | |
Total Households | 6,423 | 41,350 | 120,731 | |
Family Households | 3,882 | 22,974 | 62,176 | |
Non-Family Households | 2,541 | 18,377 | 58,555 | |
Married Couple | 2,148 | 11,572 | 31,672 | |
Other Family | 1,734 | 11,402 | 30,504 | |
Married w/Child | 996 | 4,455 | 11,657 | |
Single Male w/Child | 265 | 1,397 | 3,298 | |
Single Female w/Child | 900 | 5,176 | 14,215 |
Population Change Last Two Decades - Plus Projection
2000 | % | 2010 | % | 2020 | % | 2030 | |
---|---|---|---|---|---|---|---|
Ohio | 11,353,140 | +2 | 11,536,504 | 0 | 11,574,870 | 0 | 11,615,100 |
Franklin County | 1,068,978 | +9 | 1,163,414 | +11 | 1,291,320 | +8 | 1,394,980 |
Total Working Age Population:
Total Households:
Total Working Age Population:
Total Households:
Total Working Age Population:
Total Households: