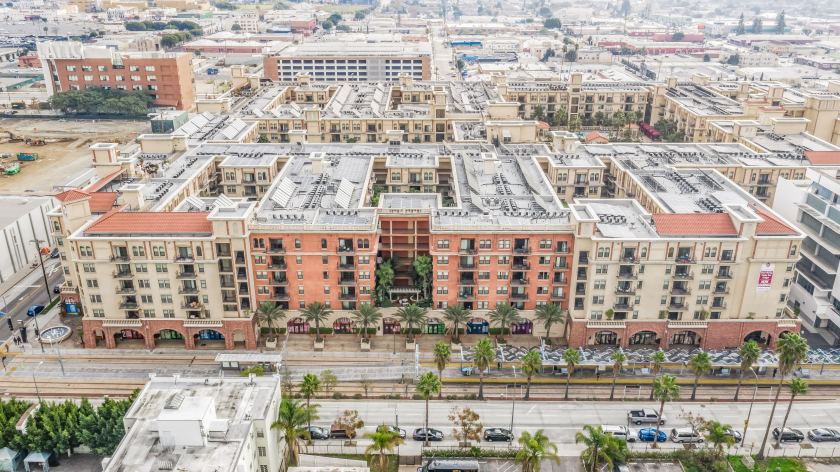
Retail Space
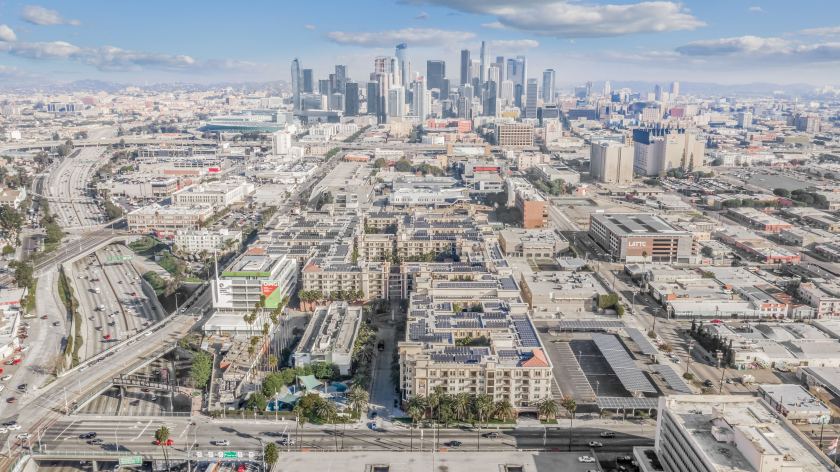
325 West Adams Boulevard Los Angeles, CA 90007
325 West Adams Boulevard Los Angeles, CA 90007

Details & Description
Property Highlights
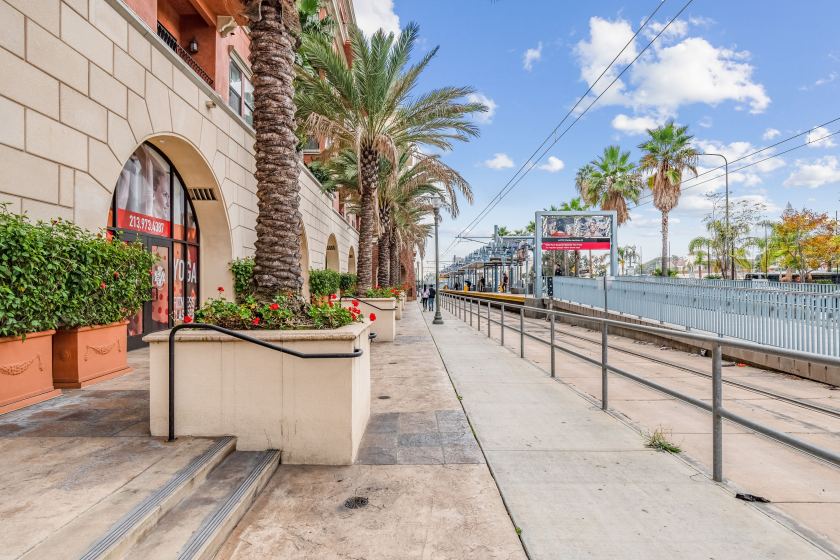
• Excellent parking ratio of 111,000 SF Capture the 1.4 million annual riders of the LA MetroExpo
• Capture the daytime traffic that must currently drive or walk a distance to reach amenities
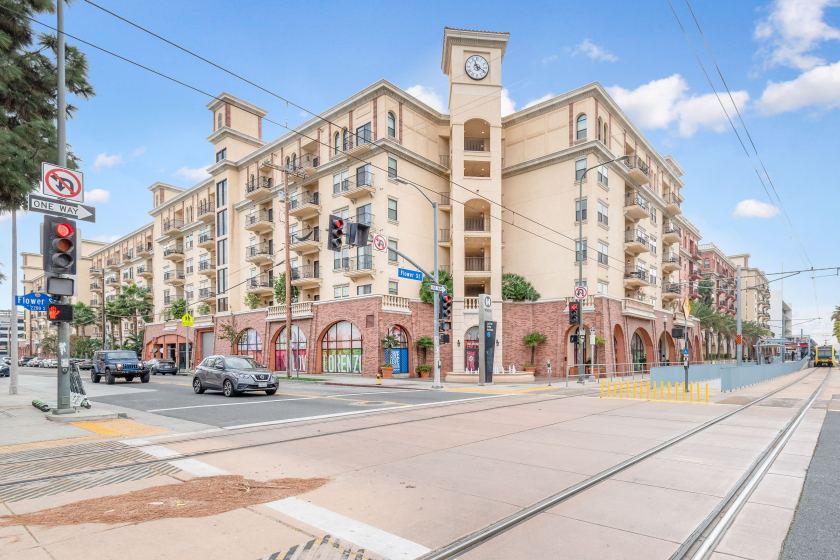
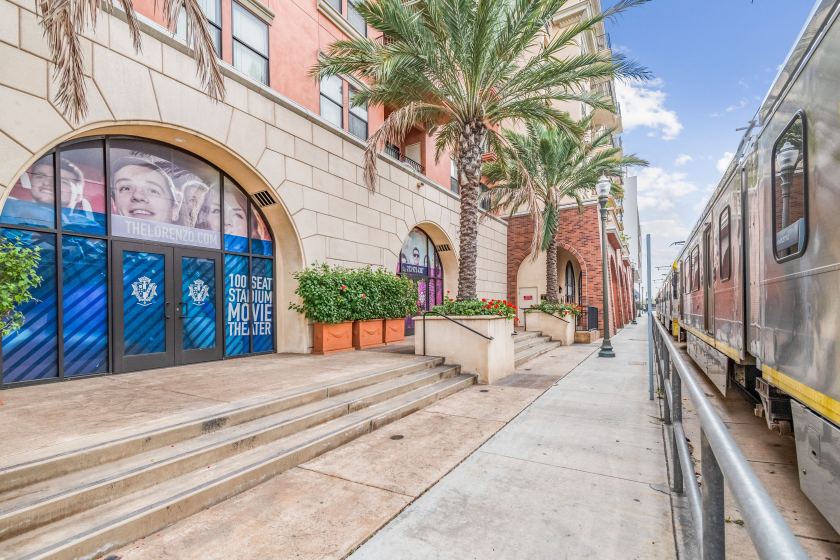
Additional Photos

Listing Agents

Yansy Naranjo
O: 213-471-7323
yansy.naranjo@avisonyoung.com
O: 213-471-7323
yansy.naranjo@avisonyoung.com
While we strive to provide the most accurate information, all listing information, and demographic data, is provided by third-parties. As such, MyEListing will not be responsible for the accuracy of the information. It is strongly recommended that you verify all information with the listing agent, and any relevant agencies, prior to making any decisions.