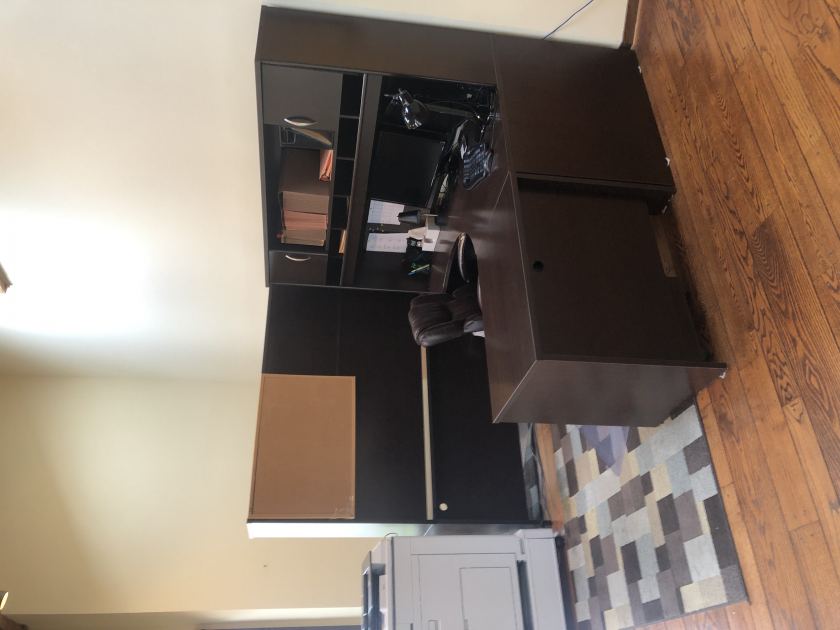
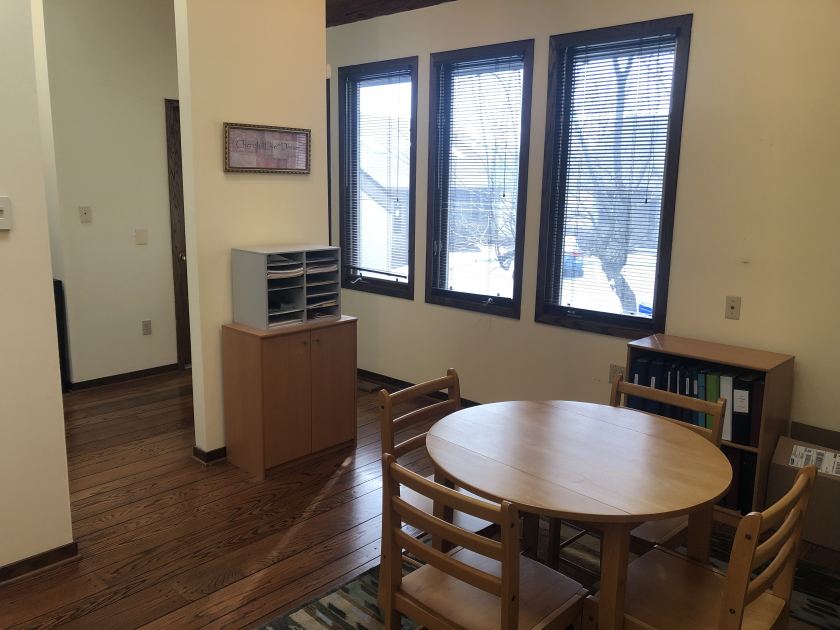
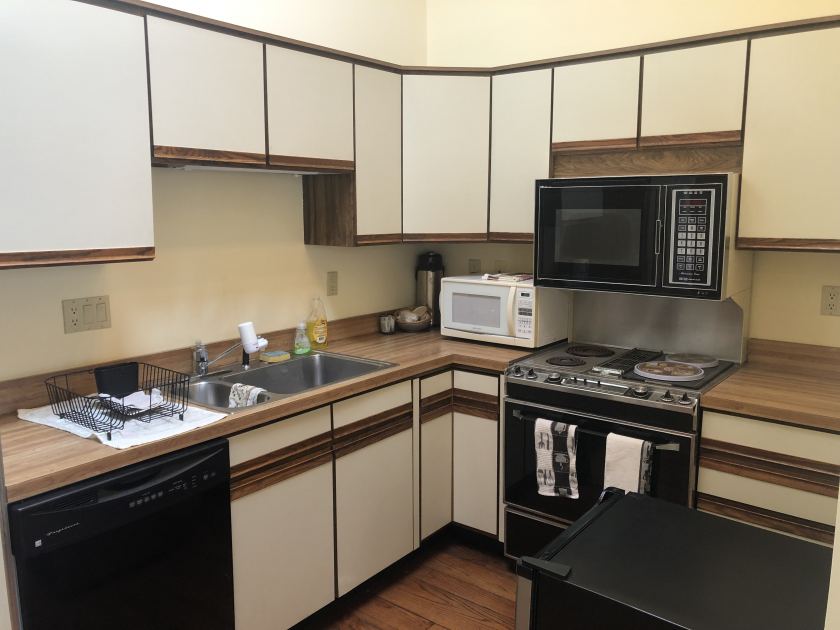
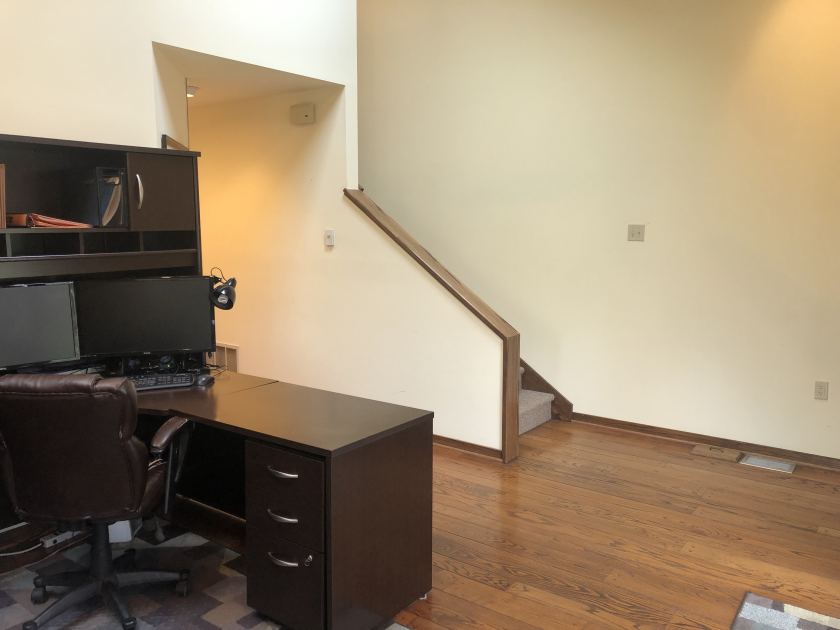
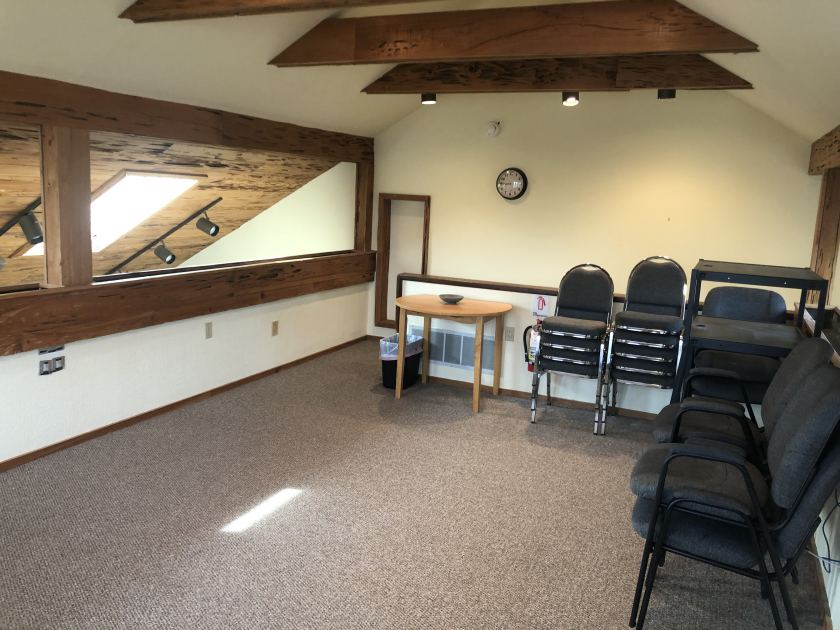
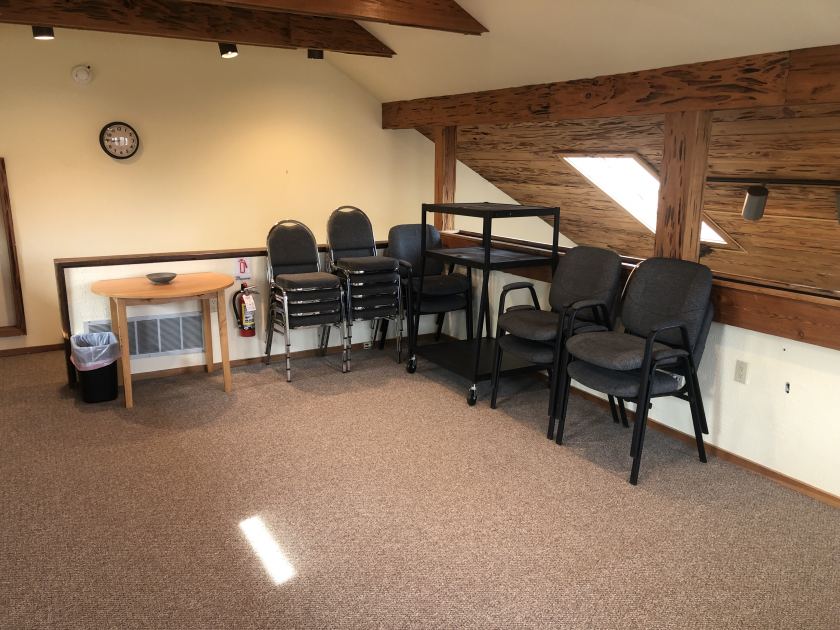
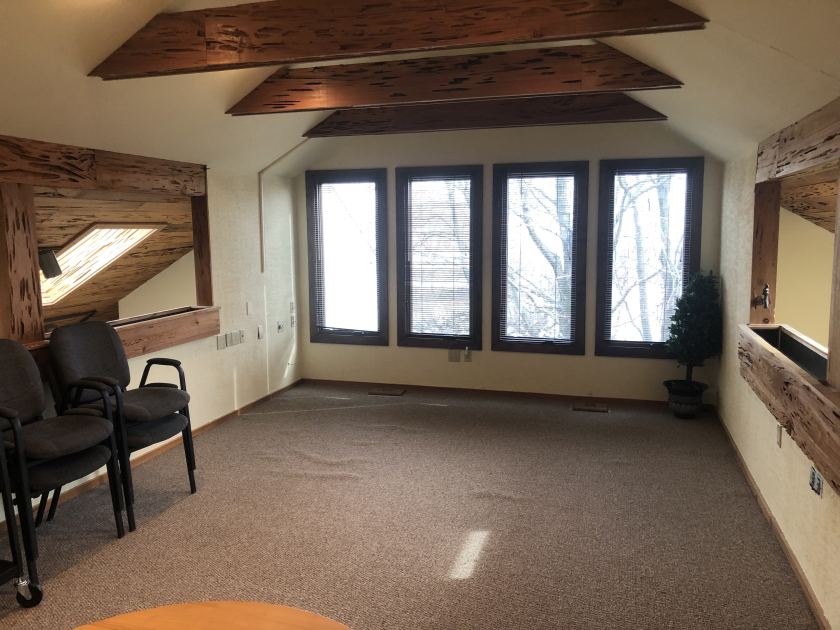
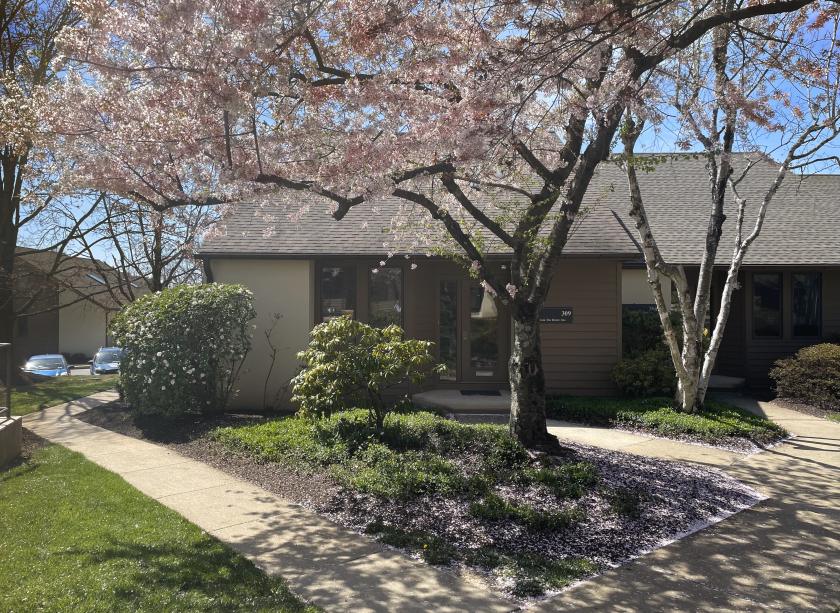
1-Mile | 3-Miles | 5-Miles | ||
---|---|---|---|---|
Total Population | 4,036 | 41,441 | 96,080 | |
Population Median Age | 39 | 39 | 40 | |
Population by Age | 0-9 Yrs | 458 (11%) | 5062 (12%) | 11321 (11%) |
10-19 Yrs | 461 (11%) | 5609 (13%) | 12201 (12%) | |
20-29 Yrs | 475 (11%) | 4583 (11%) | 10881 (11%) | |
30-39 Yrs | 759 (18%) | 6212 (14%) | 12628 (13%) | |
40-49 Yrs | 481 (11%) | 5219 (12%) | 12516 (13%) | |
50-59 Yrs | 625 (15%) | 6333 (15%) | 14347 (14%) | |
60-69 Yrs | 491 (12%) | 4949 (11%) | 11811 (12%) | |
70+ Yrs | 286 (7%) | 3473 (8%) | 10374 (10%) | |
Median HH Income | $107,259 | $113,604 | $111,543 | |
Total Household Income | < 24K | 166 (10%) | 1014 (6%) | 2905 (7%) |
25-49K | 125 (7%) | 1767 (11%) | 4367 (11%) | |
50-74K | 159 (10%) | 1856 (11%) | 4667 (12%) | |
75-99K | 260 (16%) | 1997 (12%) | 4570 (12%) | |
100-199K | 590 (37%) | 5926 (38%) | 12776 (34%) | |
200K+ | 277 (17%) | 2933 (18%) | 7552 (20%) | |
Highest Education Level | No Diploma | 100 | 1061 | 2160 |
Diploma or GED | 420 | 3912 | 10002 | |
Some College | 416 | 3795 | 8317 | |
Assoc. Degree | 196 | 2142 | 4732 | |
Bachelors Degree | 1124 | 10894 | 25658 | |
Higher Degree | 708 | 6897 | 16457 | |
Total Housing Units | 1,626 | 16,158 | 38,439 | |
--Owner-Occupied | 737 | 11,459 | 27,456 | |
--Renter-Occupied | 840 | 4,034 | 9,379 | |
Owner-Occupied Values | < 100K | 10 | 214 | 518 |
100-199K | 18 | 383 | 1167 | |
200-299K | 168 | 3253 | 6044 | |
300-399K | 214 | 3016 | 6316 | |
400-499K | 105 | 2387 | 6165 | |
500K+ | 221 | 2207 | 7247 | |
Total Working Age Population | 3,232 | 32,862 | 77,236 | |
In Work Force | 2,234 | 24,045 | 54,566 | |
Not In Work Force | 998 | 8,817 | 22,670 | |
Workforce Employed | 2,201 | 23,211 | 52,668 | |
Workforce Unemployed | 33 | 790 | 1,840 | |
Civlian Workforce | 2,234 | 24,002 | 54,508 | |
Military Workforce | 0 | 43 | 58 | |
Total Households | 1,576 | 15,493 | 36,836 | |
Family Households | 1,096 | 11,179 | 25,935 | |
Non-Family Households | 481 | 4,314 | 10,901 | |
Married Couple | 961 | 9,269 | 21,974 | |
Other Family | 135 | 1,910 | 3,961 | |
Married w/Child | 466 | 4,373 | 9,741 | |
Single Male w/Child | 10 | 309 | 507 | |
Single Female w/Child | 45 | 609 | 1,269 |
Population Change Last Two Decades - Plus Projection
2000 | % | 2010 | % | 2020 | % | 2030 | |
---|---|---|---|---|---|---|---|
Pennsylvania | 12,281,054 | +3 | 12,702,379 | +4 | 13,230,170 | +4 | 13,759,594 |
Chester County | 433,501 | +15 | 498,886 | +7 | 533,837 | +7 | 573,576 |
Total Working Age Population:
Total Households:
Total Working Age Population:
Total Households:
Total Working Age Population:
Total Households: