Office Space
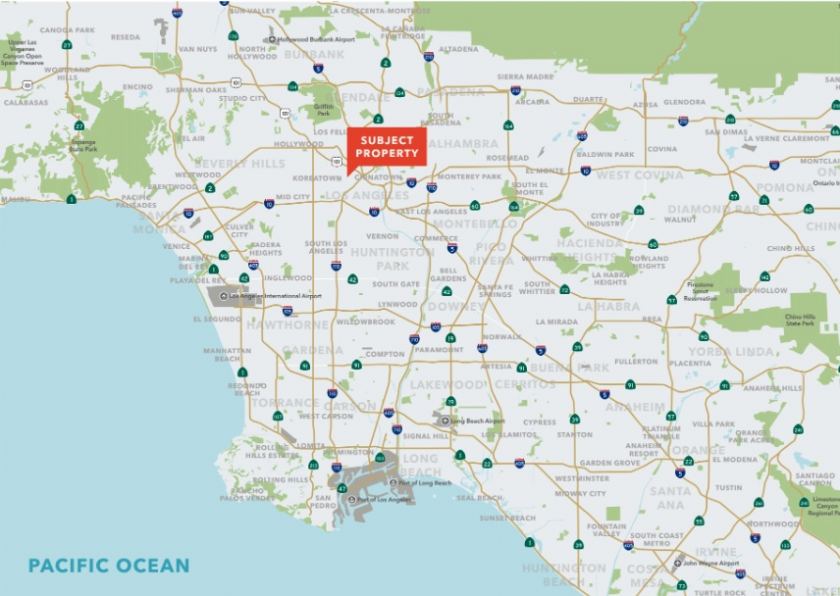
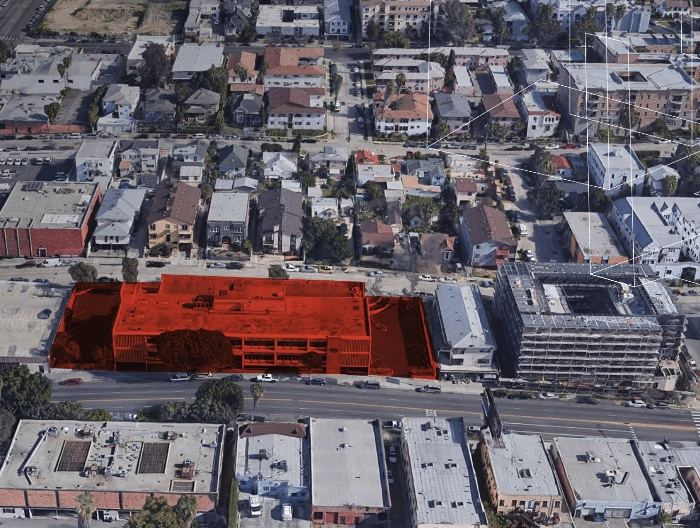
130 S Alvarado St. and 121 S Mountain View Ave. Los Angeles, CA 90057
130 S Alvarado St. and 121 S Mountain View Ave. Los Angeles, CA 90057

Details & Description
Property Highlights
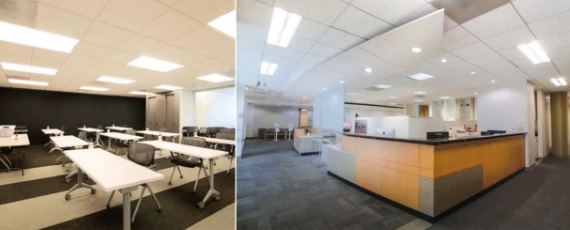
- • Pride of Ownership building in excellent condition
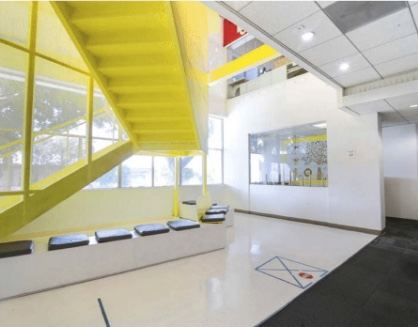
- • Stunning remodel completed
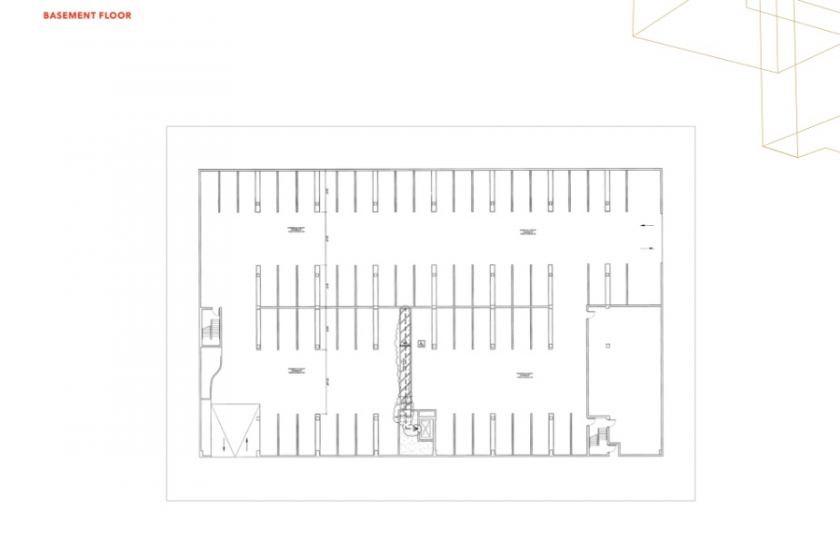
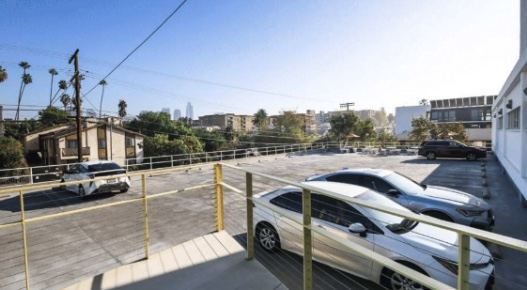
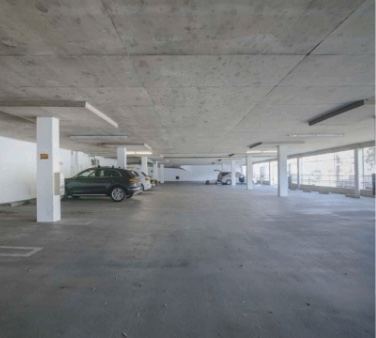
- • Ample rooftop, surface, and covered parking
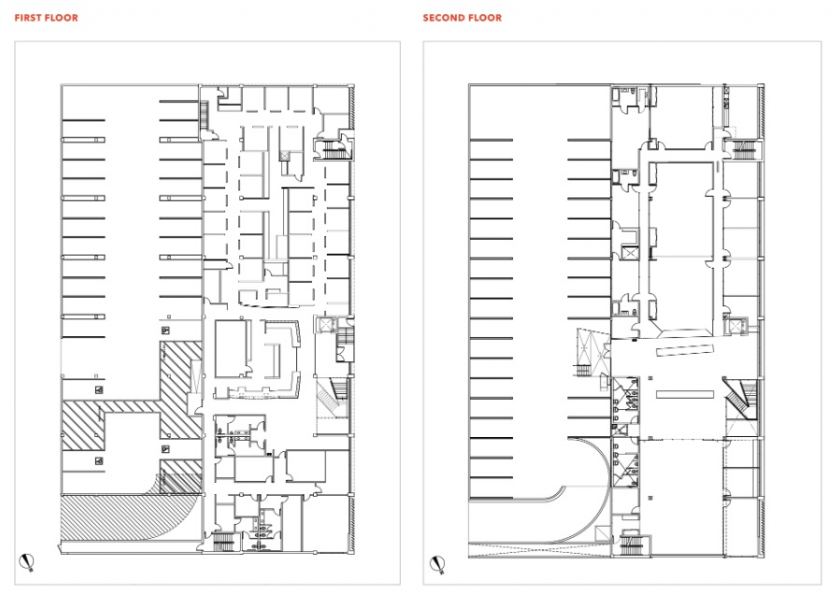
- • High ceilings throughout
- • Close proximity to public transportation
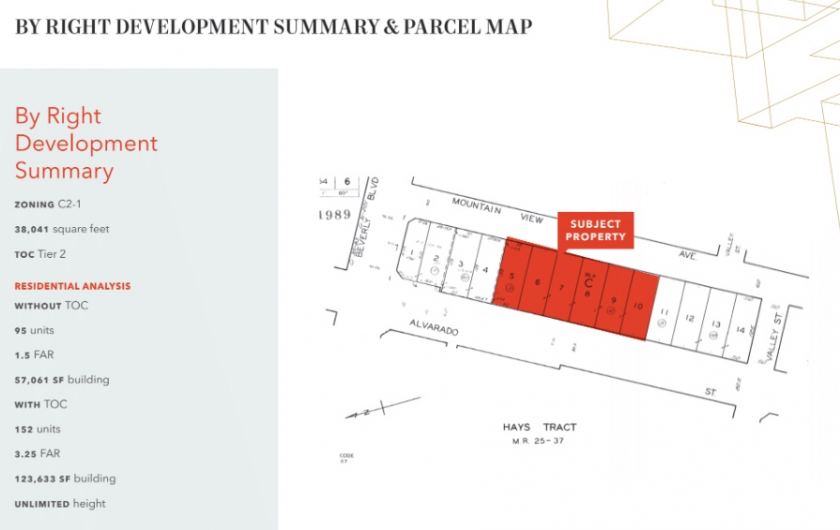
- • State enterprise zone and TOC Tier 2
Additional Photos


Listing Agents

John Anthony
O: 213-225-7218
M: 213-507-5570
john.anthony@kidder.com
O: 213-225-7218
M: 213-507-5570
john.anthony@kidder.com

Christopher Steck
O: 213-225-7231
christopher.steck@kidder.com
O: 213-225-7231
christopher.steck@kidder.com
While we strive to provide the most accurate information, all listing information, and demographic data, is provided by third-parties. As such, MyEListing will not be responsible for the accuracy of the information. It is strongly recommended that you verify all information with the listing agent, and any relevant agencies, prior to making any decisions.