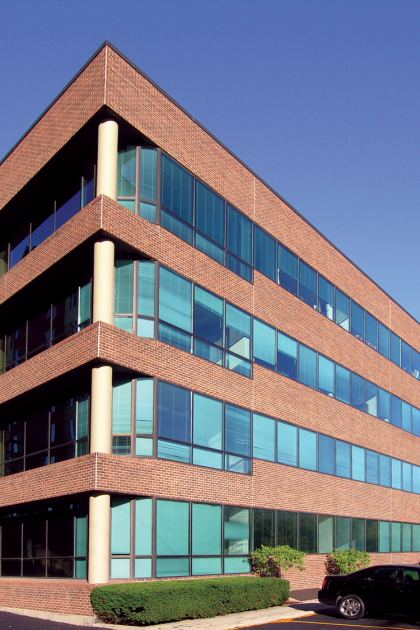
1-Mile | 3-Miles | 5-Miles | ||
---|---|---|---|---|
Total Population | 9,169 | 116,628 | 348,838 | |
Population Median Age | 42 | 42 | 42 | |
Population by Age | 0-9 Yrs | 895 (9%) | 13722 (11%) | 39494 (11%) |
10-19 Yrs | 1331 (14%) | 12533 (10%) | 37897 (10%) | |
20-29 Yrs | 912 (9%) | 12617 (10%) | 39286 (11%) | |
30-39 Yrs | 930 (10%) | 14827 (12%) | 47060 (13%) | |
40-49 Yrs | 1370 (14%) | 15794 (13%) | 44992 (12%) | |
50-59 Yrs | 1494 (16%) | 17815 (15%) | 50579 (14%) | |
60-69 Yrs | 1005 (10%) | 13614 (11%) | 42643 (12%) | |
70+ Yrs | 1232 (13%) | 15708 (13%) | 46886 (13%) | |
Median HH Income | $84,253 | $82,111 | $72,583 | |
Total Household Income | < 24K | 431 (12%) | 6420 (14%) | 21733 (16%) |
25-49K | 623 (17%) | 7589 (16%) | 24347 (18%) | |
50-74K | 509 (14%) | 6861 (15%) | 22085 (16%) | |
75-99K | 608 (17%) | 6382 (14%) | 18028 (13%) | |
100-199K | 958 (26%) | 12193 (26%) | 34665 (26%) | |
200K+ | 446 (12%) | 5926 (13%) | 11558 (8%) | |
Highest Education Level | No Diploma | 448 | 7914 | 27457 |
Diploma or GED | 1337 | 18026 | 63335 | |
Some College | 1330 | 15522 | 48123 | |
Assoc. Degree | 592 | 6661 | 20997 | |
Bachelors Degree | 1715 | 23055 | 61194 | |
Higher Degree | 1071 | 13780 | 33577 | |
Total Housing Units | 3,851 | 48,361 | 140,717 | |
--Owner-Occupied | 2,893 | 32,842 | 94,299 | |
--Renter-Occupied | 681 | 12,530 | 38,117 | |
Owner-Occupied Values | < 100K | 167 | 1709 | 5917 |
100-199K | 486 | 4853 | 16650 | |
200-299K | 964 | 7292 | 28718 | |
300-399K | 485 | 7975 | 23093 | |
400-499K | 291 | 4933 | 9989 | |
500K+ | 499 | 6080 | 9933 | |
Total Working Age Population | 7,480 | 95,130 | 286,549 | |
In Work Force | 4,997 | 62,297 | 184,840 | |
Not In Work Force | 2,483 | 32,833 | 101,709 | |
Workforce Employed | 4,894 | 60,058 | 177,142 | |
Workforce Unemployed | 103 | 2,199 | 7,599 | |
Civlian Workforce | 4,997 | 62,256 | 184,741 | |
Military Workforce | 0 | 41 | 99 | |
Total Households | 3,574 | 45,372 | 132,416 | |
Family Households | 2,343 | 30,034 | 88,492 | |
Non-Family Households | 1,231 | 15,338 | 43,925 | |
Married Couple | 1,921 | 24,163 | 69,211 | |
Other Family | 422 | 5,871 | 19,280 | |
Married w/Child | 839 | 9,736 | 27,879 | |
Single Male w/Child | 40 | 673 | 1,755 | |
Single Female w/Child | 149 | 1,672 | 5,586 |
Population Change Last Two Decades - Plus Projection
2000 | % | 2010 | % | 2020 | % | 2030 | |
---|---|---|---|---|---|---|---|
Illinois | 12,419,293 | +3 | 12,830,632 | +12 | 14,316,487 | +6 | 15,138,849 |
Cook County | 5,376,741 | -3 | 5,194,675 | +10 | 5,707,832 | +5 | 5,990,243 |
DuPage County | 904,161 | +1 | 916,924 | +10 | 1,010,323 | +2 | 1,034,039 |
Total Working Age Population:
Total Households:
Total Working Age Population:
Total Households:
Total Working Age Population:
Total Households: