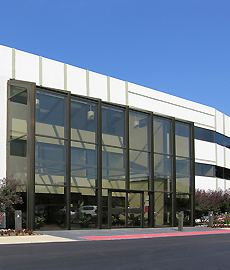
Office Space
1020 North Milwaukee Avenue Deerfield, IL 60015
1020 North Milwaukee Avenue Deerfield, IL 60015
Details & Description
Property Highlights
• Near restaurants casual fine dining, shopping and hotels
• Excellent location at Deerfield Road Milwaukee Avenue
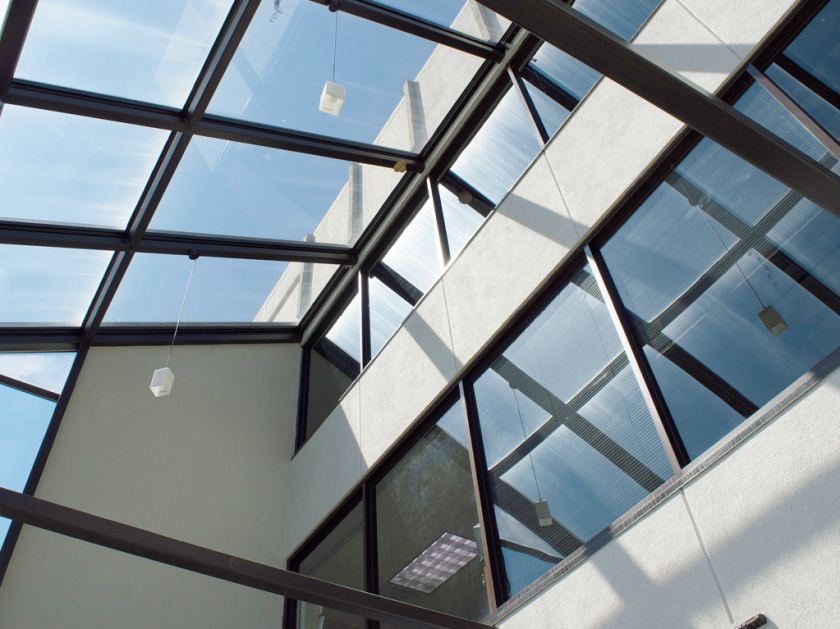
Additional Photos


Listing Agents

Alan Raphaeli
O: 847-330-1300
araphaeli@marcrealty.com
O: 847-330-1300
araphaeli@marcrealty.com
While we strive to provide the most accurate information, all listing information, and demographic data, is provided by third-parties. As such, MyEListing will not be responsible for the accuracy of the information. It is strongly recommended that you verify all information with the listing agent, and any relevant agencies, prior to making any decisions.


