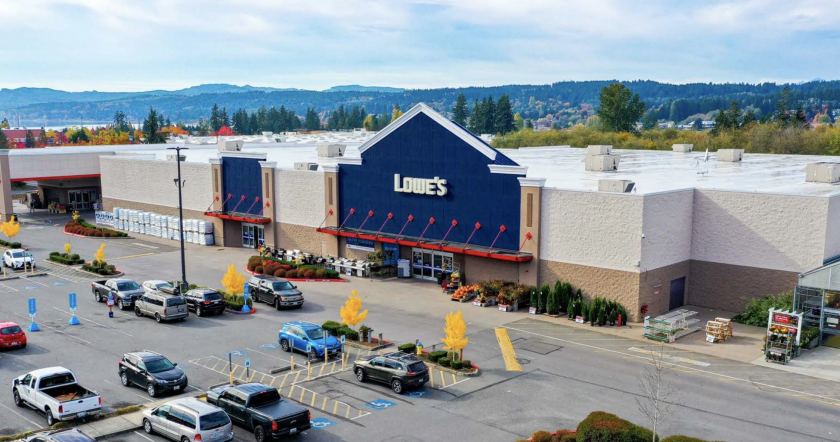
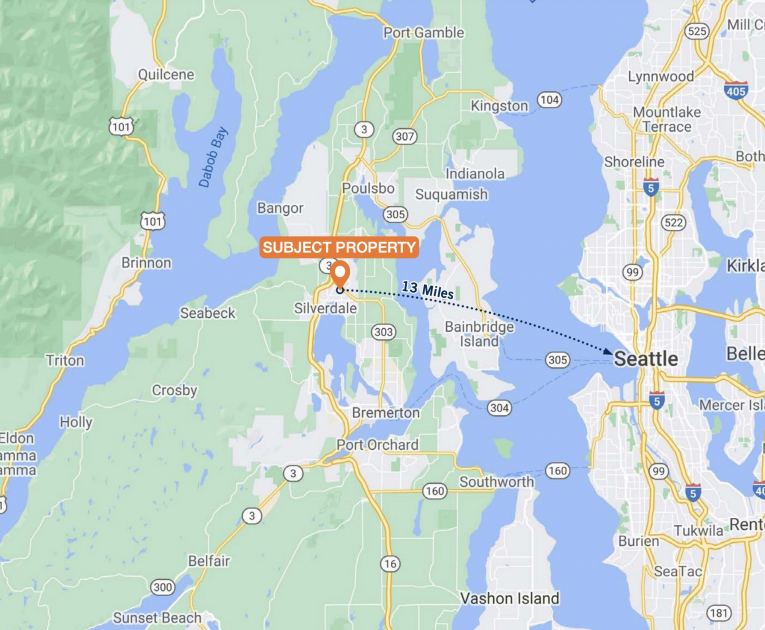
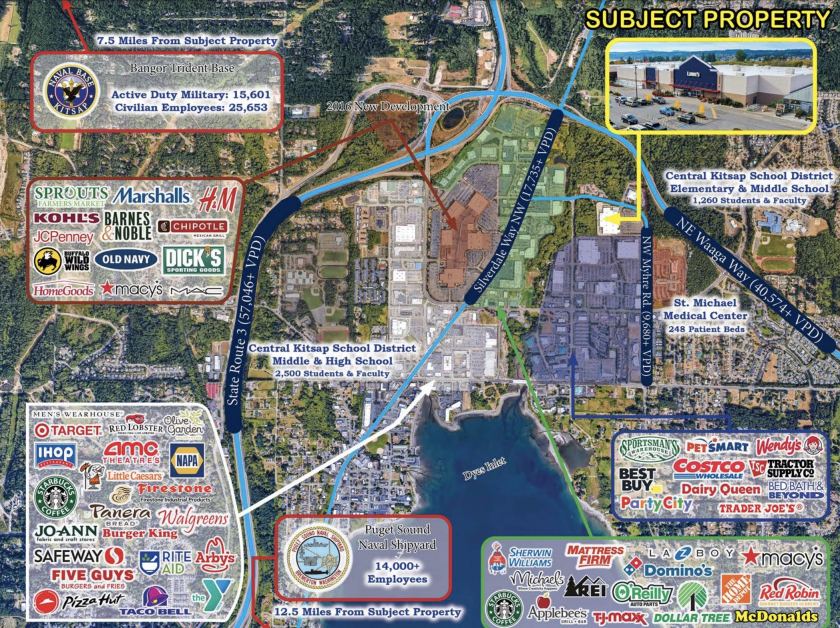
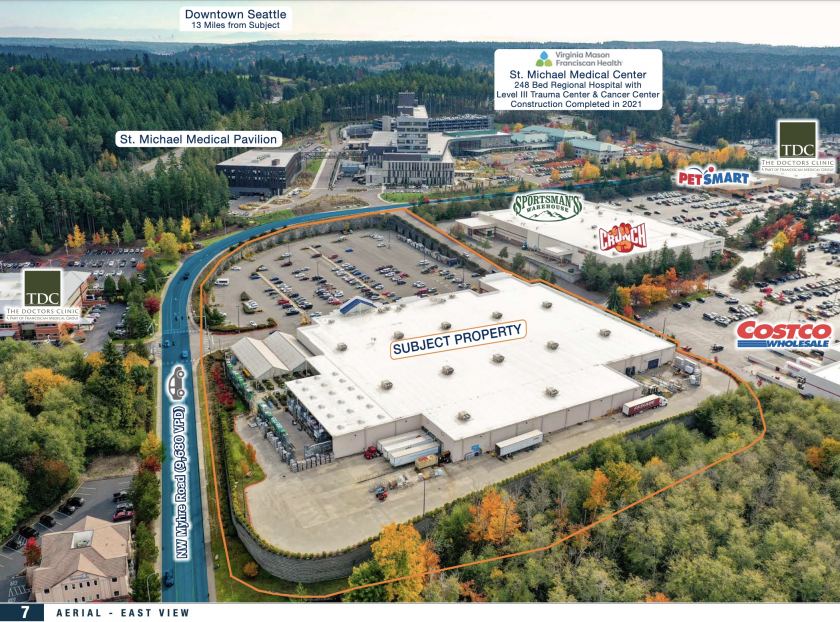
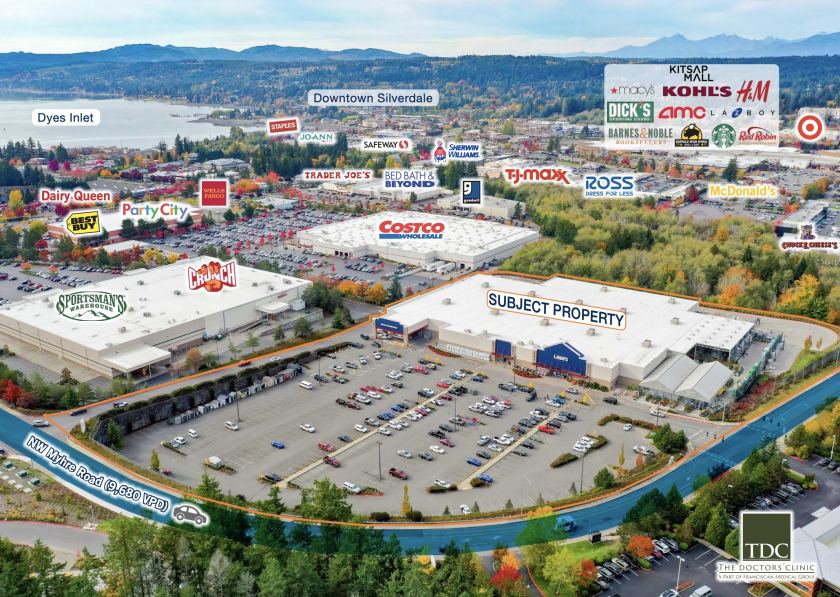
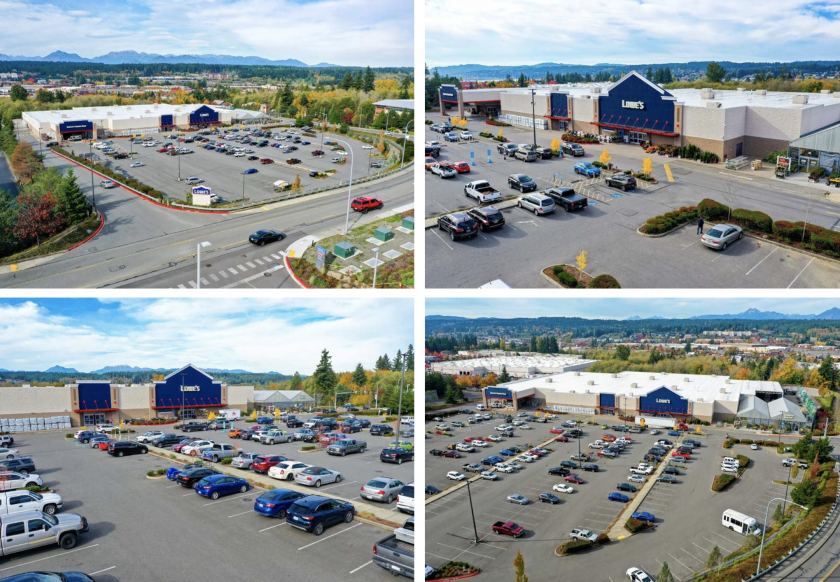
Marcus & Millichap is pleased to present the fee simple interest in this Lowe’s location in Silverdale, Washington. This 111,000 SF property has 7 years remaining on an Absolute Net Ground Lease with four, 5-year renewal options and 10% rental increases in each option. The property sits on a large 12+ acre lot with a large, fully lit parking lot and two points of ingress and egress. This location sits in a dense retail corridor that is the main retail hub of the surrounding area. The property is adjacent to a Costco, Bestbuy, Trader Joe’s and Crunch Fitness across the street from the Kitsap Mall, the largest retail center in the area. There are strong demographics with the average Household income exceeding $103,000 in a 5-mile radius. Silverdale is a census-designated place in Kitsap County, Washington. Silverdale is located on the Kitsap Peninsula. It is 9 miles northwest of the city of Bremerton and the same distance south of Poulsbo. Silverdale lies at the north tip of Dyes Inlet, which connects it to Bremerton via Sinclair Inlet and to the Pacific Ocean via Port Orchard and Puget Sound. Commerce in Silverdale is primarily divided into two geographic areas: Old Town Silverdale along the northeast edge of Dyes Inlet, and the Kitsap Mall and big box stores (Costco Wholesale Center, REI, Best Buy, Target, Trader Joe’s and T.J. Maxx) just north within SR 3 and SR 303. In addition to the Port of Silverdale, Old Town Silverdale is home to many salons, restaurants, and medical offices.Building Area: 111,000-Sq.Ft.Land Acres: 12.43 ± Acres36,000+ VPD on Silverdale Way & 53,000+ VPD on WA State Rte. 3Situated in a Dominant Retail Corridor of Silverdale, Adjacent to Multiple National Retailers Such as Costco, TJ Maxx, Ross Dress for Less, Sportsman’s Warehouse, Best Buy, Bed Bath & Beyond, Trader Joe’s PetSmart, Macy’s, JC Penny, Kohl’s, and Many More!Strong Visibility Along Myhre Road Across from St. Michael Medical Center, a Major Hospital in the Area with a Large Expansion Completed in 2021.