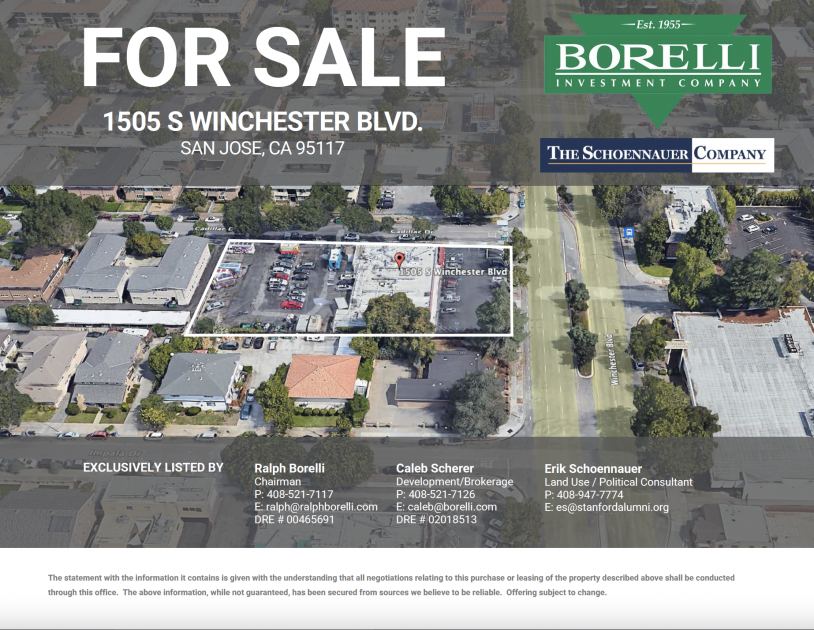
1-Mile | 3-Miles | 5-Miles | ||
---|---|---|---|---|
Total Population | 29,692 | 237,315 | 581,368 | |
Population Median Age | 38 | 39 | 38 | |
Population by Age | 0-9 Yrs | 4102 (13%) | 30472 (12%) | 70850 (12%) |
10-19 Yrs | 2877 (9%) | 24266 (10%) | 68626 (11%) | |
20-29 Yrs | 3924 (13%) | 31021 (13%) | 81042 (13%) | |
30-39 Yrs | 5420 (18%) | 40134 (16%) | 92072 (15%) | |
40-49 Yrs | 3673 (12%) | 33442 (14%) | 83463 (14%) | |
50-59 Yrs | 4286 (14%) | 32188 (13%) | 77322 (13%) | |
60-69 Yrs | 2834 (9%) | 23815 (10%) | 55354 (9%) | |
70+ Yrs | 2577 (8%) | 21977 (9%) | 52638 (9%) | |
Median HH Income | $98,675 | $114,623 | $120,478 | |
Total Household Income | < 24K | 1473 (12%) | 9612 (10%) | 22252 (10%) |
25-49K | 1563 (13%) | 10175 (11%) | 24363 (11%) | |
50-74K | 1484 (13%) | 10490 (11%) | 22676 (10%) | |
75-99K | 1219 (10%) | 9818 (10%) | 20970 (9%) | |
100-199K | 3121 (27%) | 26201 (29%) | 62119 (29%) | |
200K+ | 2489 (21%) | 23103 (25%) | 58417 (27%) | |
Highest Education Level | No Diploma | 2068 | 13526 | 32873 |
Diploma or GED | 3936 | 24520 | 53650 | |
Some College | 3512 | 28012 | 62617 | |
Assoc. Degree | 1540 | 12235 | 27282 | |
Bachelors Degree | 6166 | 52446 | 123735 | |
Higher Degree | 3831 | 39898 | 105613 | |
Total Housing Units | 12,276 | 95,255 | 222,762 | |
--Owner-Occupied | 5,260 | 43,990 | 109,231 | |
--Renter-Occupied | 6,089 | 45,410 | 101,567 | |
Owner-Occupied Values | < 100K | 45 | 496 | 1498 |
100-199K | 77 | 546 | 1102 | |
200-299K | 57 | 270 | 974 | |
300-399K | 225 | 641 | 1402 | |
400-499K | 175 | 921 | 2599 | |
500K+ | 4681 | 41116 | 101656 | |
Total Working Age Population | 23,910 | 191,477 | 469,536 | |
In Work Force | 17,054 | 132,957 | 318,155 | |
Not In Work Force | 6,856 | 58,520 | 151,382 | |
Workforce Employed | 16,374 | 128,521 | 305,312 | |
Workforce Unemployed | 665 | 4,318 | 12,622 | |
Civlian Workforce | 17,039 | 132,839 | 317,934 | |
Military Workforce | 15 | 118 | 220 | |
Total Households | 11,348 | 89,400 | 210,798 | |
Family Households | 7,123 | 59,407 | 141,985 | |
Non-Family Households | 4,225 | 29,992 | 68,812 | |
Married Couple | 5,216 | 46,142 | 112,754 | |
Other Family | 1,907 | 13,266 | 29,232 | |
Married w/Child | 2,350 | 21,446 | 53,957 | |
Single Male w/Child | 317 | 1,629 | 4,005 | |
Single Female w/Child | 642 | 4,390 | 8,437 |
Population Change Last Two Decades - Plus Projection
2000 | % | 2010 | % | 2020 | % | 2030 | |
---|---|---|---|---|---|---|---|
California | 33,871,648 | +10 | 37,253,956 | +9 | 40,467,295 | +8 | 43,631,295 |
Santa Clara County | 1,682,585 | +6 | 1,781,642 | +12 | 1,996,394 | +10 | 2,194,079 |
Total Working Age Population:
Total Households:
Total Working Age Population:
Total Households:
Total Working Age Population:
Total Households: