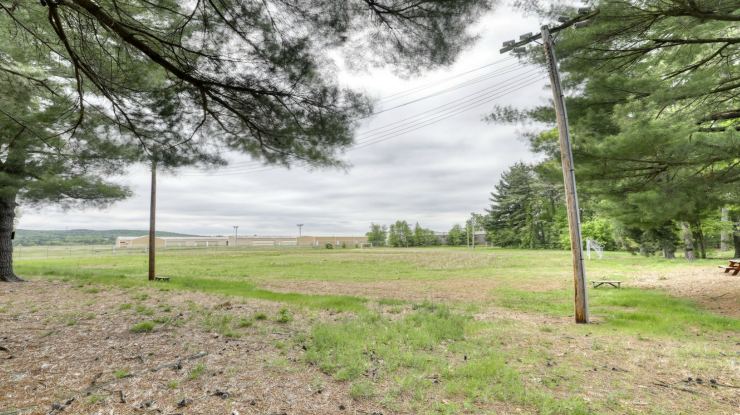
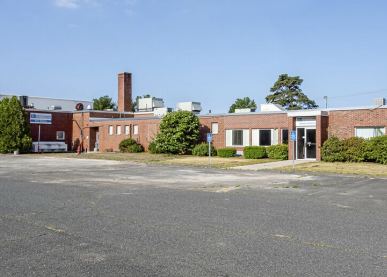
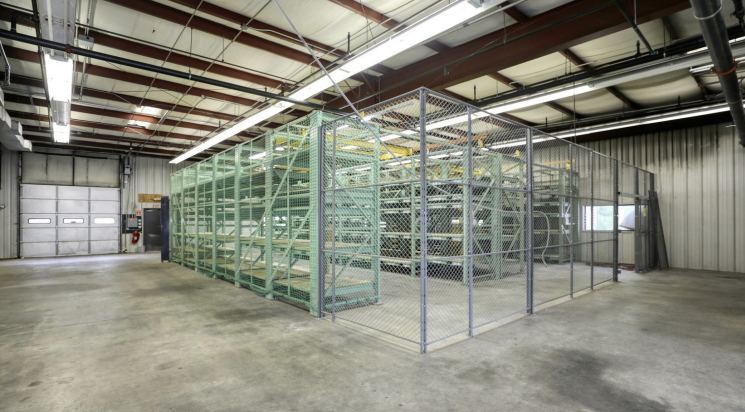
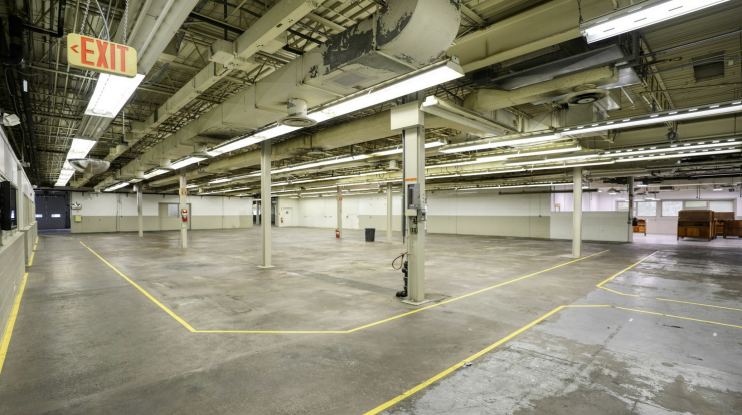
1-Mile | 3-Miles | 5-Miles | ||
---|---|---|---|---|
Total Population | 1,206 | 24,900 | 67,727 | |
Population Median Age | 44 | 40 | 41 | |
Population by Age | 0-9 Yrs | 80 (6%) | 2419 (9%) | 6073 (8%) |
10-19 Yrs | 222 (18%) | 3368 (13%) | 9255 (13%) | |
20-29 Yrs | 108 (8%) | 4042 (16%) | 10078 (14%) | |
30-39 Yrs | 99 (8%) | 2716 (10%) | 7473 (11%) | |
40-49 Yrs | 148 (12%) | 3202 (12%) | 8044 (11%) | |
50-59 Yrs | 153 (12%) | 3454 (13%) | 9900 (14%) | |
60-69 Yrs | 166 (13%) | 2720 (10%) | 8311 (12%) | |
70+ Yrs | 229 (18%) | 2980 (11%) | 8592 (12%) | |
Median HH Income | $55,987 | $63,034 | $66,661 | |
Total Household Income | < 24K | 82 (17%) | 1685 (17%) | 3958 (15%) |
25-49K | 134 (28%) | 2213 (23%) | 5735 (22%) | |
50-74K | 67 (14%) | 1900 (19%) | 4822 (18%) | |
75-99K | 36 (7%) | 1120 (11%) | 3176 (12%) | |
100-199K | 117 (24%) | 2053 (21%) | 6293 (24%) | |
200K+ | 39 (8%) | 565 (5%) | 1782 (6%) | |
Highest Education Level | No Diploma | 70 | 2101 | 4885 |
Diploma or GED | 282 | 5301 | 13563 | |
Some College | 185 | 3350 | 8309 | |
Assoc. Degree | 93 | 1428 | 4425 | |
Bachelors Degree | 132 | 3144 | 9361 | |
Higher Degree | 96 | 1724 | 6103 | |
Total Housing Units | 514 | 10,185 | 26,928 | |
--Owner-Occupied | 417 | 5,883 | 17,709 | |
--Renter-Occupied | 59 | 3,653 | 8,057 | |
Owner-Occupied Values | < 100K | 85 | 573 | 1137 |
100-199K | 84 | 1628 | 4682 | |
200-299K | 159 | 2207 | 7049 | |
300-399K | 66 | 942 | 2881 | |
400-499K | 7 | 328 | 1253 | |
500K+ | 17 | 204 | 708 | |
Total Working Age Population | 1,012 | 20,606 | 57,291 | |
In Work Force | 601 | 13,450 | 36,308 | |
Not In Work Force | 410 | 7,156 | 20,983 | |
Workforce Employed | 583 | 12,690 | 34,653 | |
Workforce Unemployed | 16 | 673 | 1,551 | |
Civlian Workforce | 599 | 13,363 | 36,204 | |
Military Workforce | 2 | 87 | 105 | |
Total Households | 476 | 9,536 | 25,767 | |
Family Households | 313 | 6,025 | 16,285 | |
Non-Family Households | 164 | 3,511 | 9,482 | |
Married Couple | 235 | 4,196 | 12,095 | |
Other Family | 78 | 1,829 | 4,190 | |
Married w/Child | 87 | 1,663 | 4,220 | |
Single Male w/Child | 9 | 240 | 516 | |
Single Female w/Child | 9 | 559 | 1,334 |
Population Change Last Two Decades - Plus Projection
2000 | % | 2010 | % | 2020 | % | 2030 | |
---|---|---|---|---|---|---|---|
Massachusetts | 6,349,097 | +3 | 6,547,629 | +6 | 6,933,887 | +4 | 7,225,472 |
Hampden County | 456,228 | +2 | 463,490 | +1 | 470,339 | +3 | 482,178 |
Hampshire County | 152,251 | +4 | 158,080 | +2 | 161,673 | +2 | 165,099 |
Total Working Age Population:
Total Households:
Total Working Age Population:
Total Households:
Total Working Age Population:
Total Households: