Commercial Land
1590 Southwestern Boulevard West Seneca, NY 14224
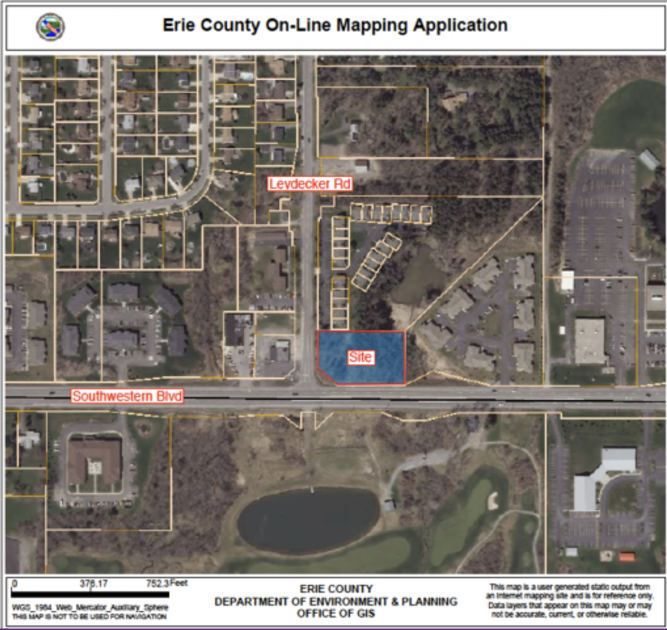
1590 Southwestern Boulevard West Seneca, NY 14224
Details & Description
Property Highlights
- • Access from two streets
- • Conveniently Located
- • Commercial Zoning
- • Built to Suit Development Site
Listing Agents

Rick Recckio
O: 716-631-5555
M: 716-998-4422
rick@recckio.com
O: 716-631-5555
M: 716-998-4422
rick@recckio.com
While we strive to provide the most accurate information, all listing information, and demographic data, is provided by third-parties. As such, MyEListing will not be responsible for the accuracy of the information. It is strongly recommended that you verify all information with the listing agent, and any relevant agencies, prior to making any decisions.


