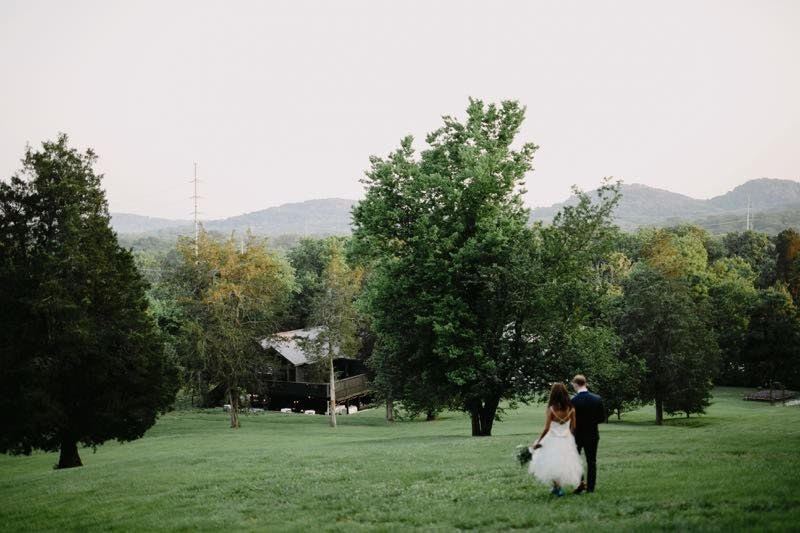
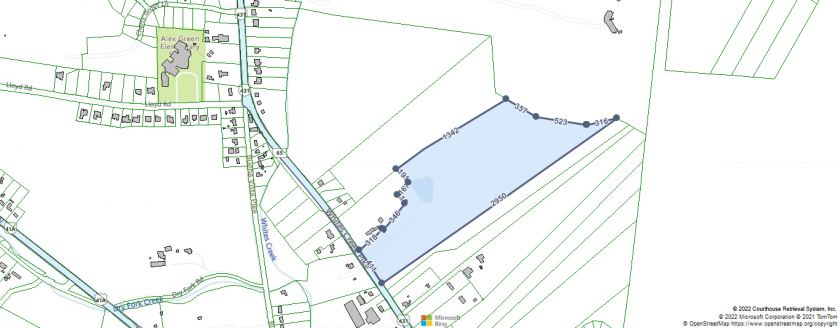
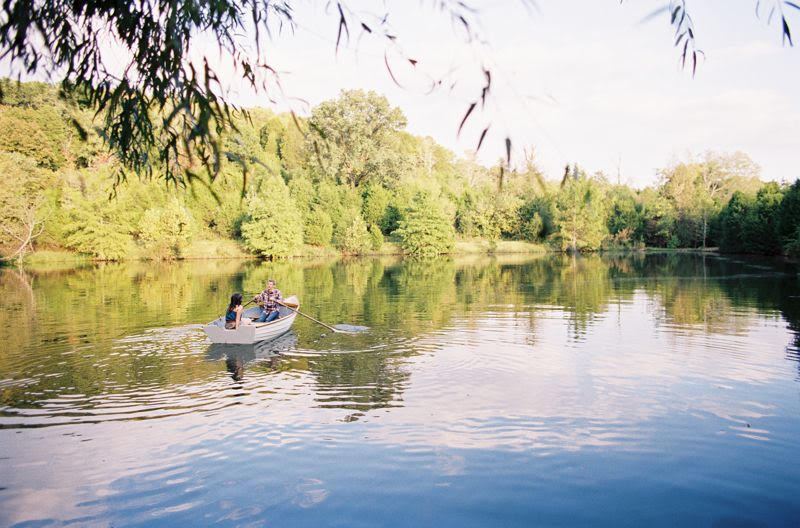
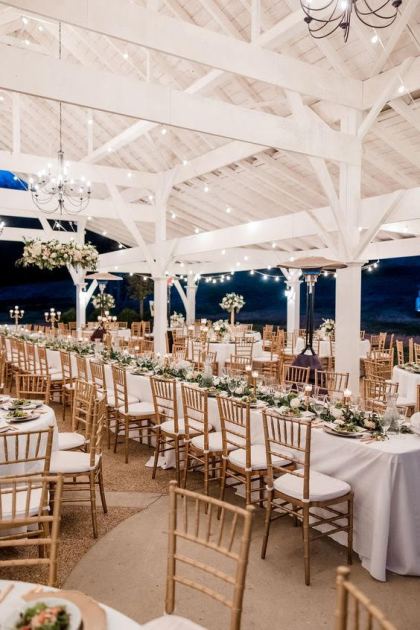
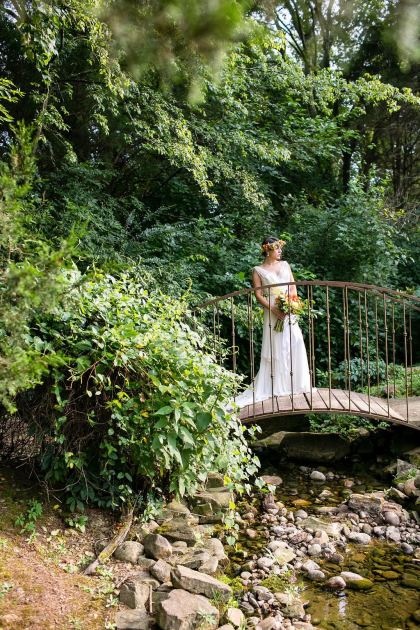
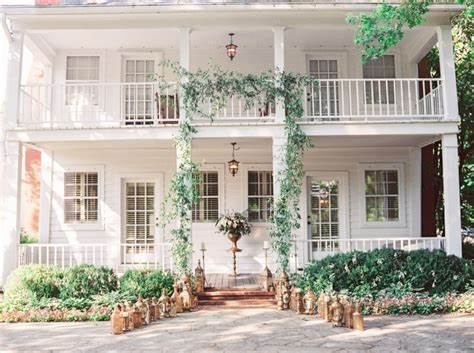
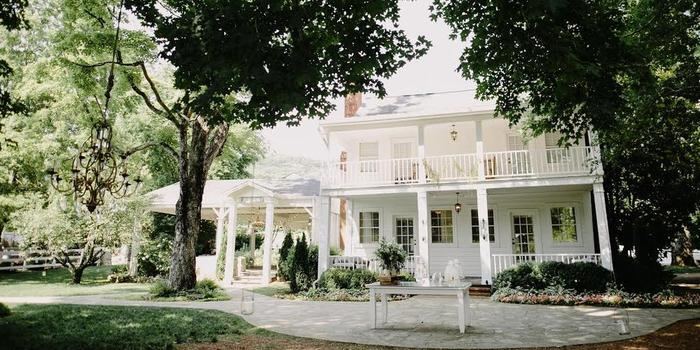
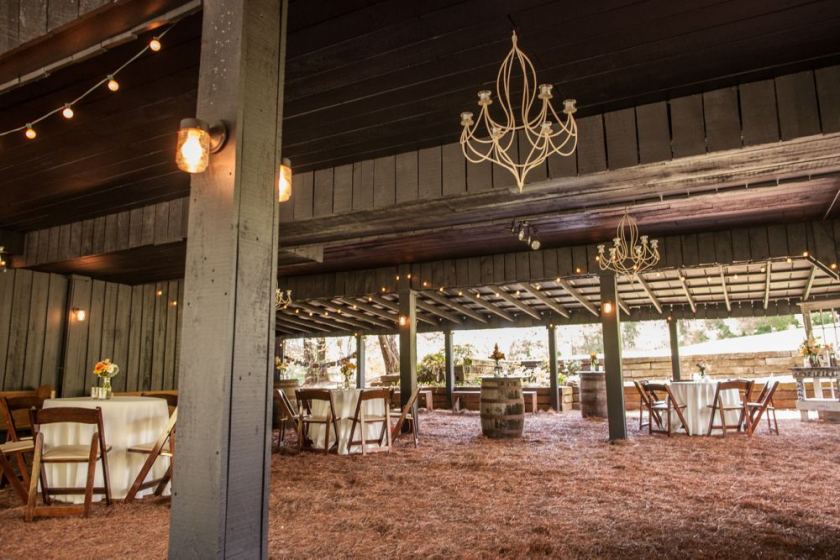
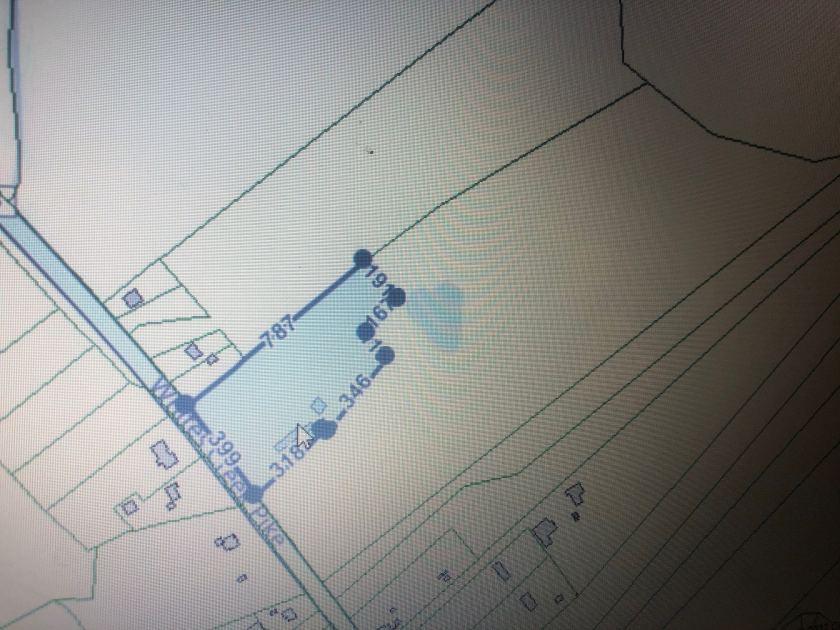
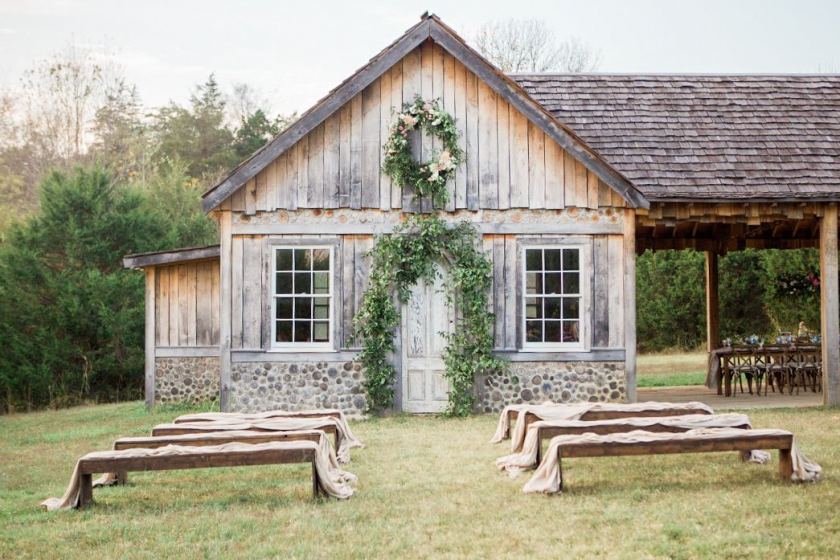
Historic Cedarwood is a beautifully preserved antebellum home nestled on 50 acres of idyllic Tennessee terrain in two parcels (both included in listing price). Just 8 miles north of Nashville making it the closest estate venue to downtown. Turn-Key, top rated business which has been featured in such publications as Southern Living, People, and The Knot just to name a few, with everything you need including all assets pertaining to the business, a year's worth of bookings, and a very connected, successful GM. Large variety of indoor and outdoor spaces including but not limited to 3200sq ft. historic home, pavilion with accommodations for up to 200 guests, covered and attached stone dance floor bar area, 2 story barn with entertainment area, cedar cabin, lake with a large, covered dock and floating dock, 2 story office space with restrooms and groom's cottage, well maintained walking paths through acreage, The parcel that the house sits on is 6.59 acres with the second parcel being 44.9 acres both are included in the listing price. The 44 additional acres is prime development land which is zoned RS15 meaning a developer would have the option of putting million dollar homes on each lot with the possibility of 30 or more lots. The house and 6 acres are on city sewer and the 44 acres could easily be put on it as well. The back of the property touches the property of the famous Fontanel, former home of the country music legend Mrs. Barbara Mandrell. Less than five minutes from the interstate and only 15 minutes from downtown Nashville. The historic house is 3200 sq ft but the office and groom's cottage has approximately 2400 additional sq ft. of heated and cooled space. 24-hour notice required for all showings. Must contact listing agent, Emily Smith (615)351-8270. Proof of funds of $1,000,000 for showings. Due to the volume of calls we will be doing showings on Wednesdays and Thursdays now. Thank you all for your patience.