Office Space
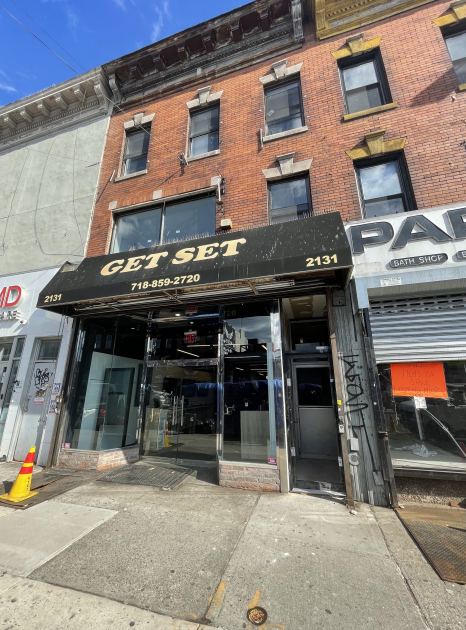
2131 Nostrand Avenue Brooklyn, NY 11210
2131 Nostrand Avenue Brooklyn, NY 11210
Details & Description
Property Highlights
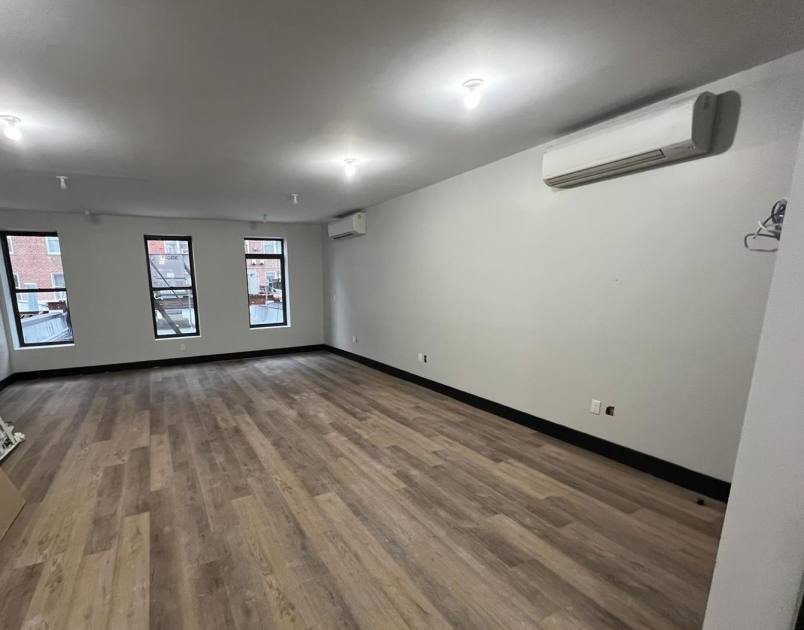
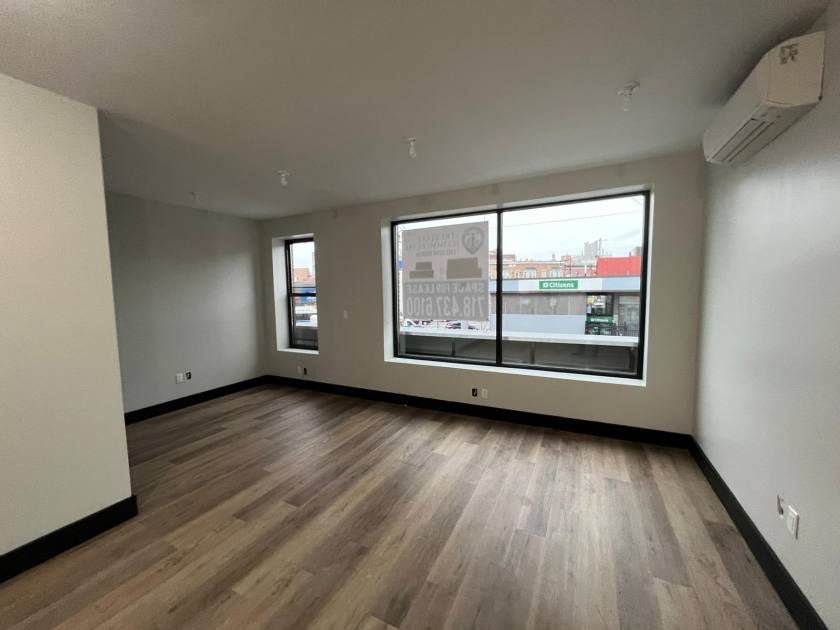
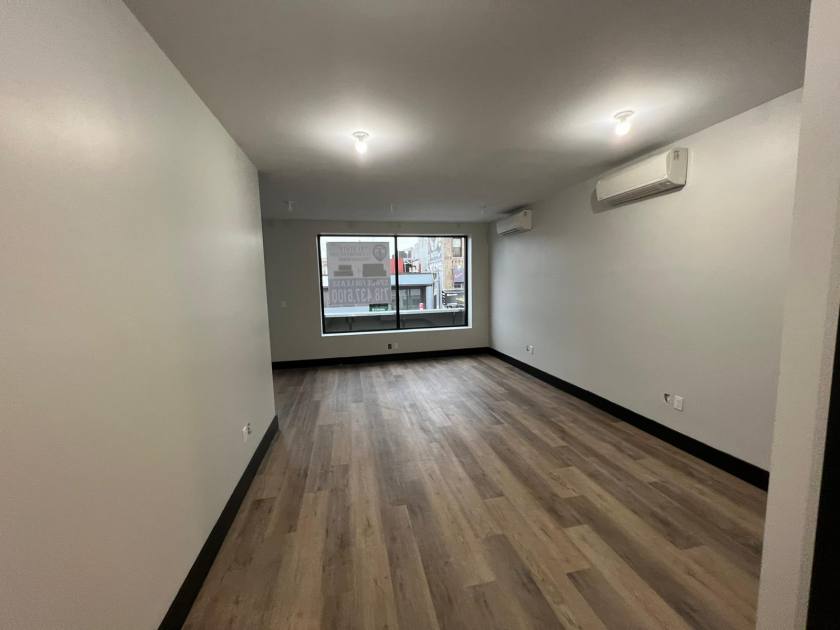
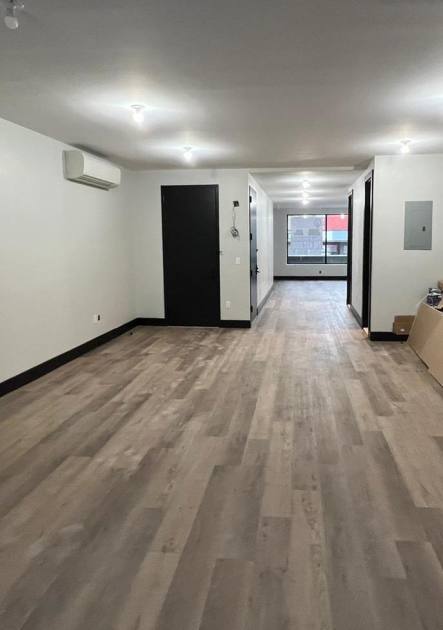
- • 2nd floor office
- • Signage opportunity
- • Natural light
- • Right by the subway
- • Across from Brooklyn College
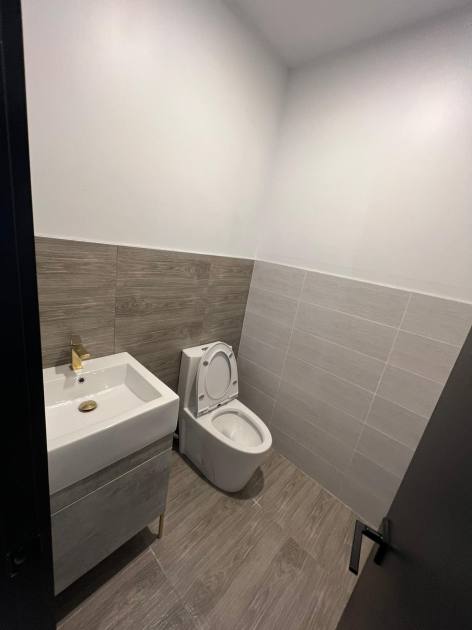
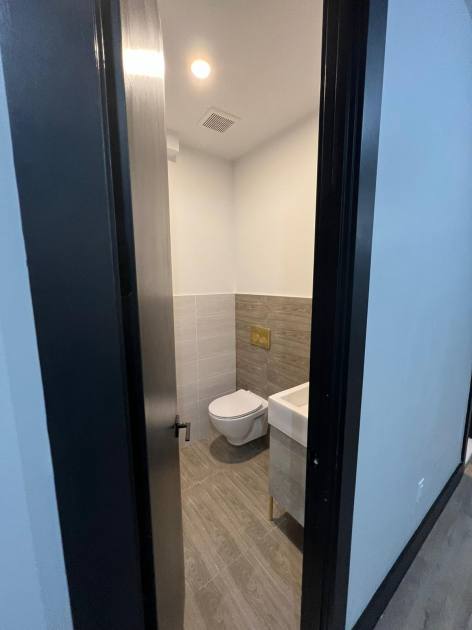
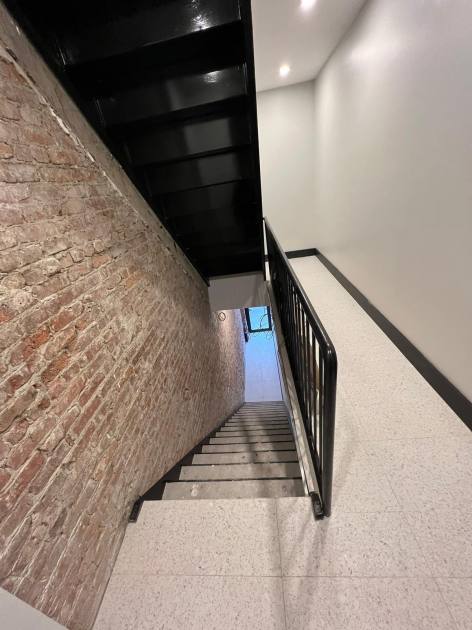
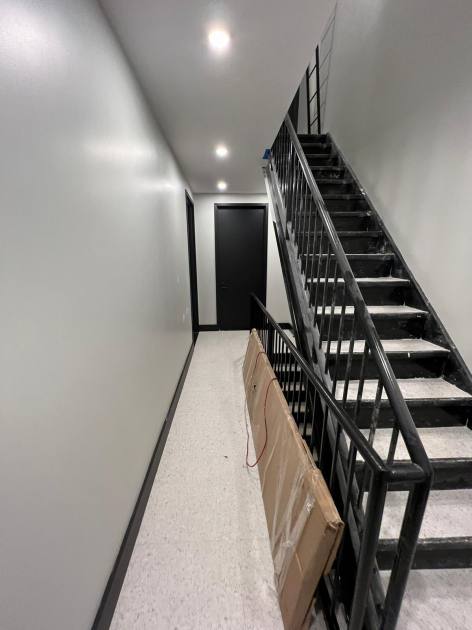
Additional Photos

Listing Agents

Shlomi Bagdadi
O: 718-437-6100
info@tristatecr.com
O: 718-437-6100
info@tristatecr.com
While we strive to provide the most accurate information, all listing information, and demographic data, is provided by third-parties. As such, MyEListing will not be responsible for the accuracy of the information. It is strongly recommended that you verify all information with the listing agent, and any relevant agencies, prior to making any decisions.