Commercial Land
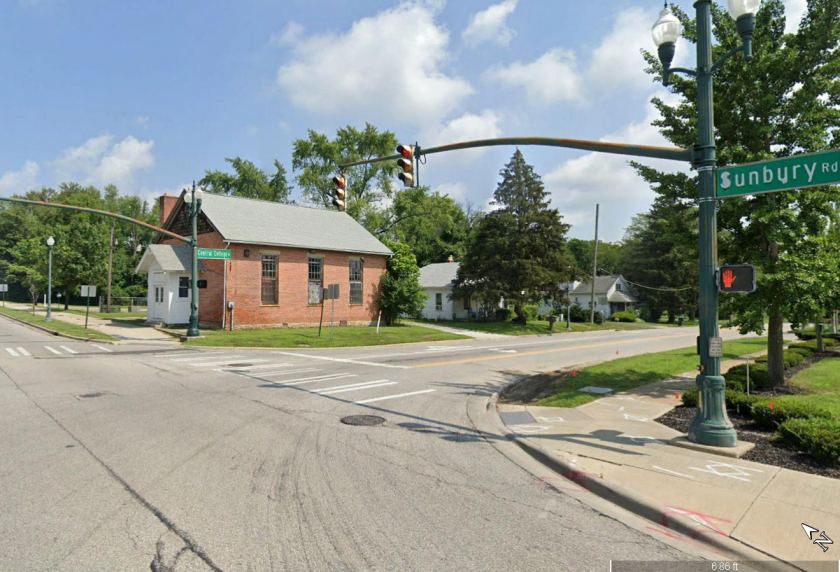
1230 Central College Road Westerville, OH 43081
1230 Central College Road Westerville, OH 43081

Details & Description
Property Highlights
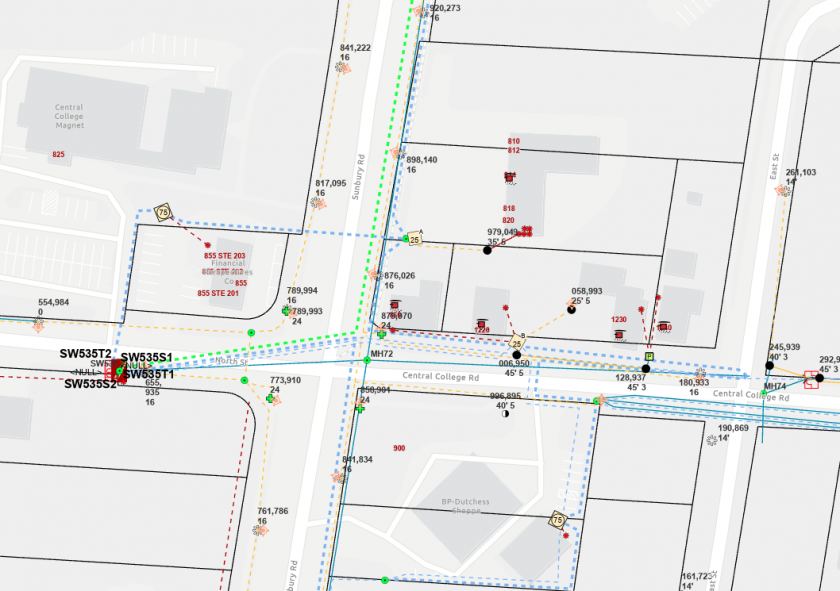
• PUBLIC UTILITIES AVAILABLE IF ALL 3 PARCELS PURCHASED TOGETHER
• WESTERVILLE COMMERCIAL REDEVELOPMENT OPPORTUNITY
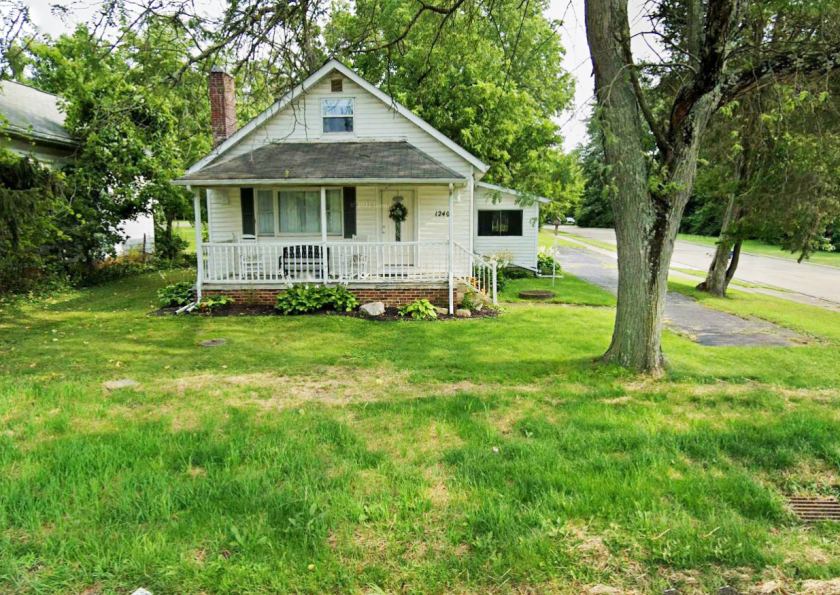
Additional Photos


Listing Agents

Skip Weiler
O: 614-221-4286
skip@rweiler.com
O: 614-221-4286
skip@rweiler.com
While we strive to provide the most accurate information, all listing information, and demographic data, is provided by third-parties. As such, MyEListing will not be responsible for the accuracy of the information. It is strongly recommended that you verify all information with the listing agent, and any relevant agencies, prior to making any decisions.