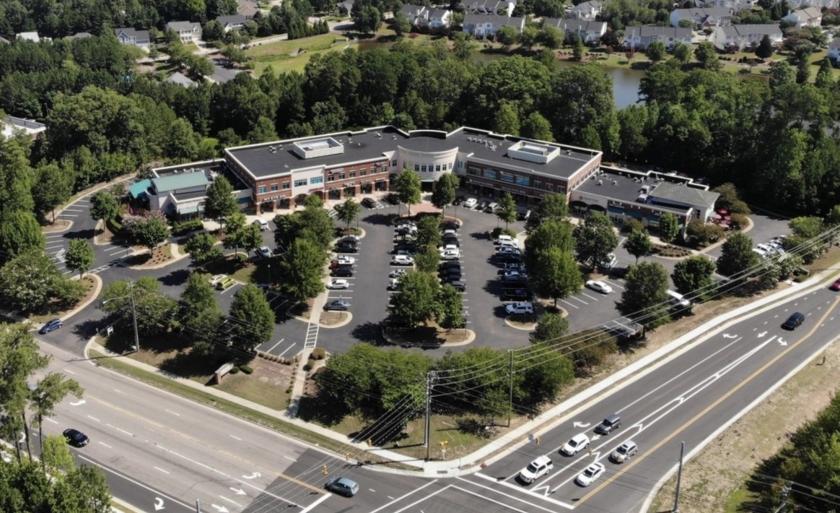
Office Space
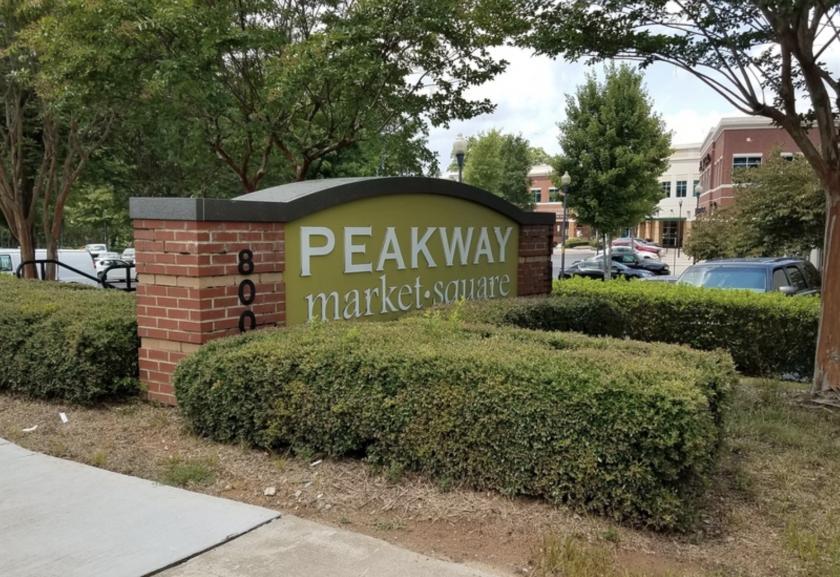
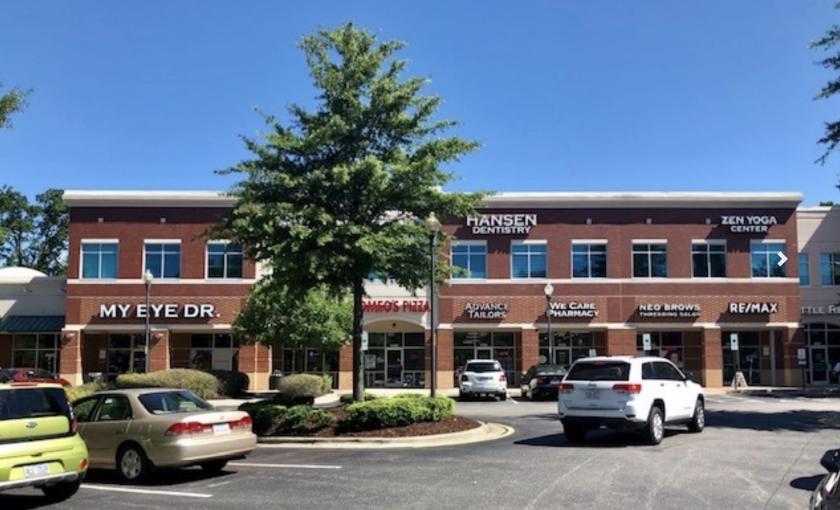
800 West Williams Street Apex, NC 27502
800 West Williams Street Apex, NC 27502
Details & Description
Property Highlights
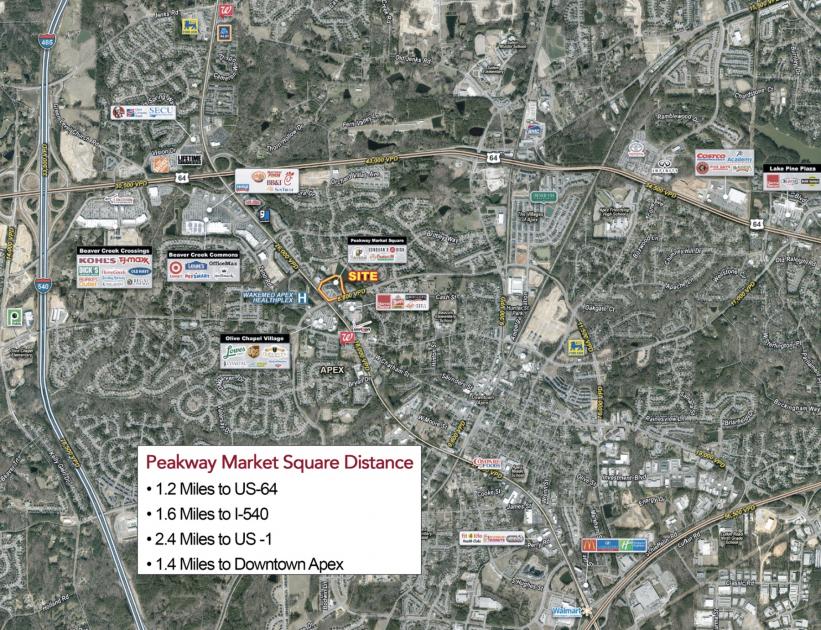
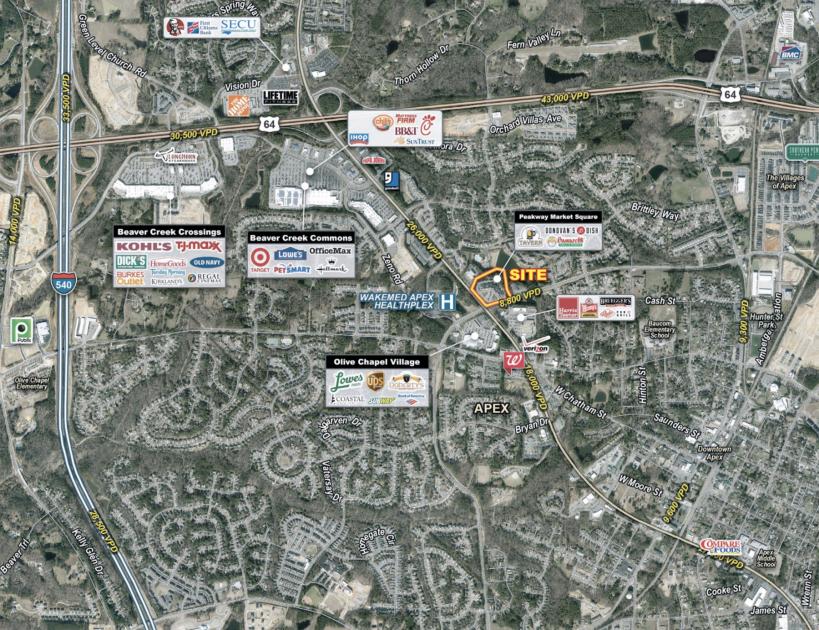
• Convenient to several retail shopping centers - Olive Chapel Village, Haddon Hall Commons and Beaver Creek Commons
• Mixed use center located at the intersection of W. Williams Street (Hwy. 55) and Apex Peakway
Additional Photos
Listing Agents

Brian Farmer
O: 919-576-2503
M: 919-730-6584
bfarmer@lee-associates.com
O: 919-576-2503
M: 919-730-6584
bfarmer@lee-associates.com

Jenn Olevitch-Roberson
O: 919-576-2517
M: 919-345-1752
jolevitch-roberson@lee-associates.com
O: 919-576-2517
M: 919-345-1752
jolevitch-roberson@lee-associates.com
While we strive to provide the most accurate information, all listing information, and demographic data, is provided by third-parties. As such, MyEListing will not be responsible for the accuracy of the information. It is strongly recommended that you verify all information with the listing agent, and any relevant agencies, prior to making any decisions.


