Office Space
5540 Centerview Drive Raleigh, NC 27606
5540 Centerview Drive Raleigh, NC 27606
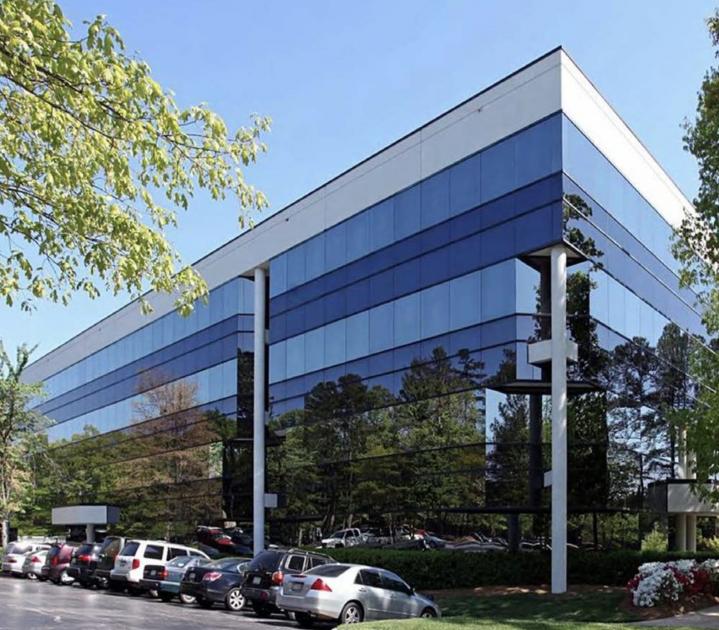
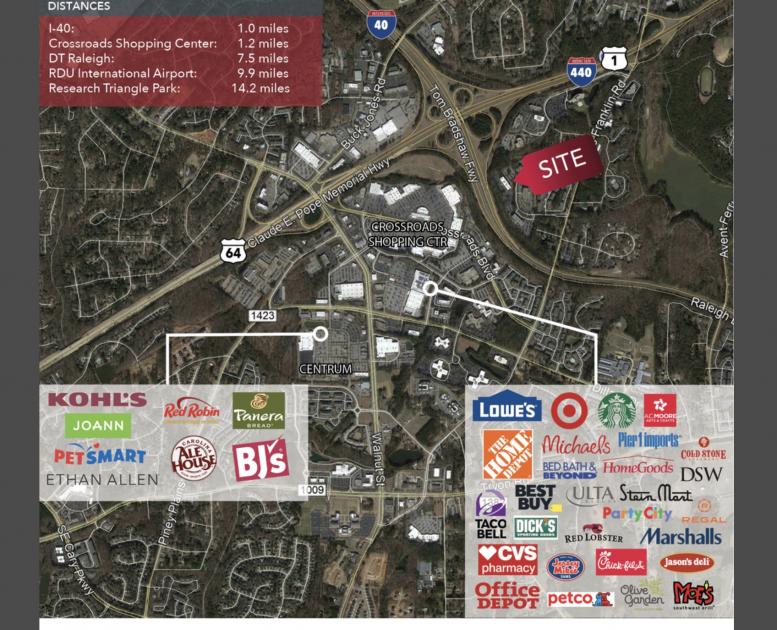
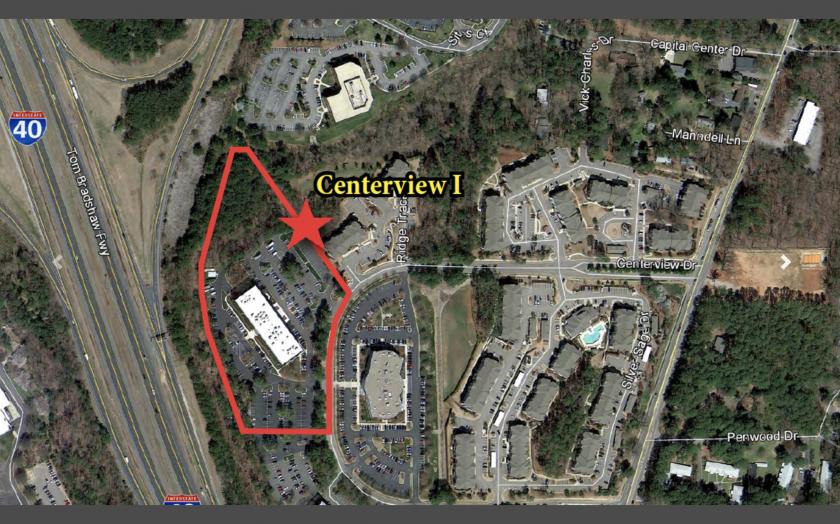
Details & Description
Property Highlights
- • Suite 303: 1,248 RSF
- • Suite 317: 2,290 RSF
- • Suite 400: 1,542 RSF
- • Suite 405: 2,554 RSF
- • Suite 409: 1,057 RSF
- • Level 3 fiber optics on site
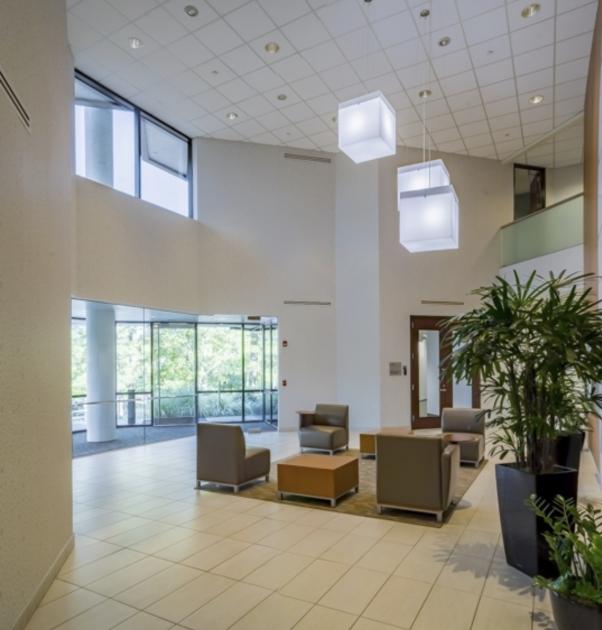
Additional Photos


Listing Agents

Scott Hadley
O: 919-576-2504
M: 919-906-0524
shadley@lee-associates.com
O: 919-576-2504
M: 919-906-0524
shadley@lee-associates.com

Jonathon Harriss
Lee & Associates
O: 919-591-2278
M: 980-226-6738
jharriss@lee-associates.com
Lee & Associates
O: 919-591-2278
M: 980-226-6738
jharriss@lee-associates.com
While we strive to provide the most accurate information, all listing information, and demographic data, is provided by third-parties. As such, MyEListing will not be responsible for the accuracy of the information. It is strongly recommended that you verify all information with the listing agent, and any relevant agencies, prior to making any decisions.