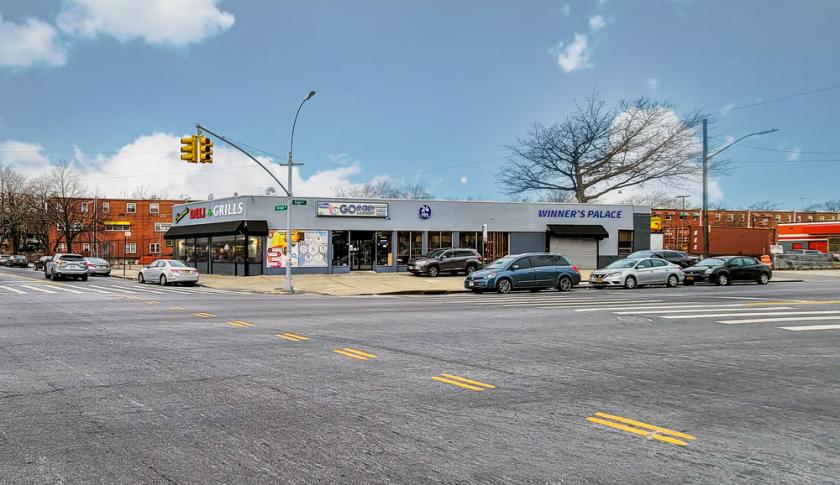
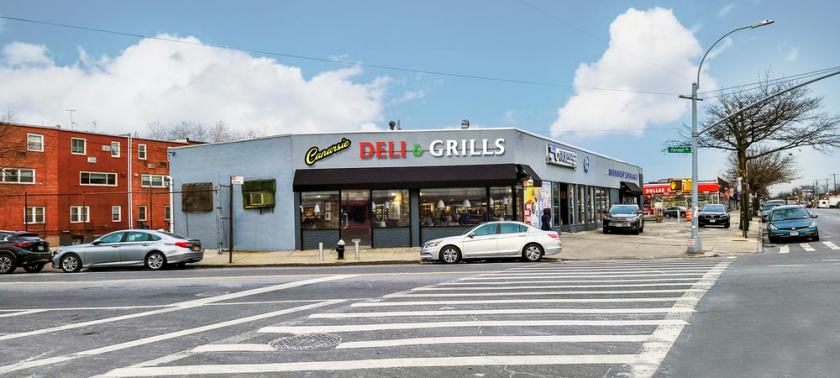
Retail Space
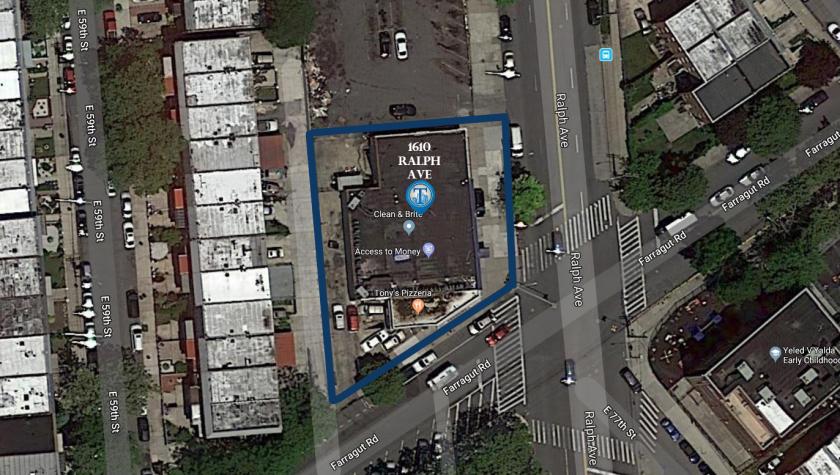
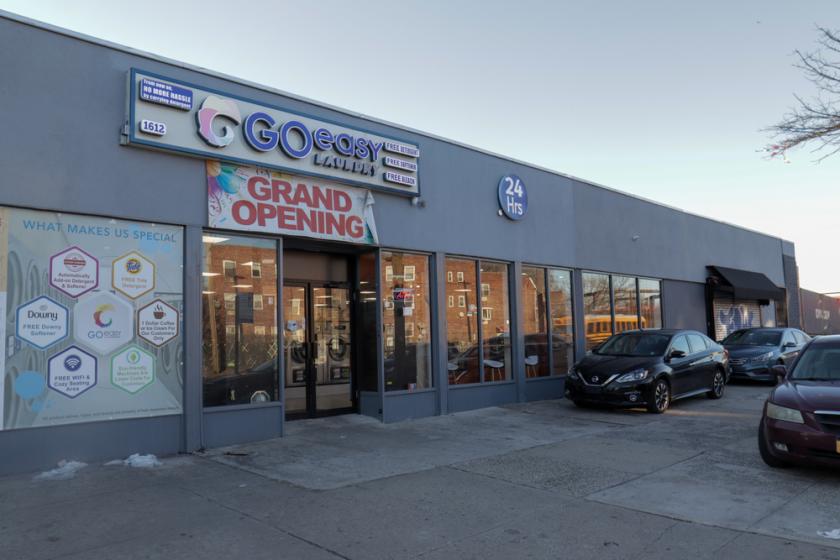
1610 Ralph Avenue Brooklyn, NY 11236
1610 Ralph Avenue Brooklyn, NY 11236
Details & Description
Property Highlights
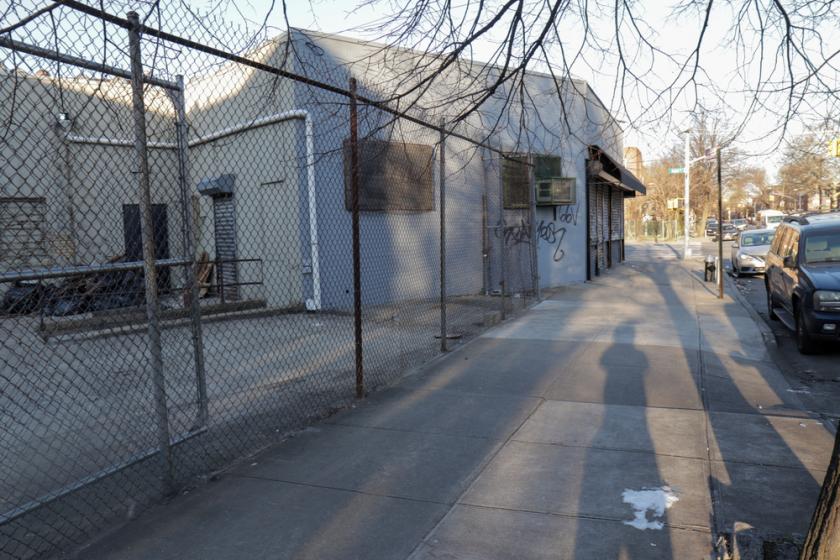
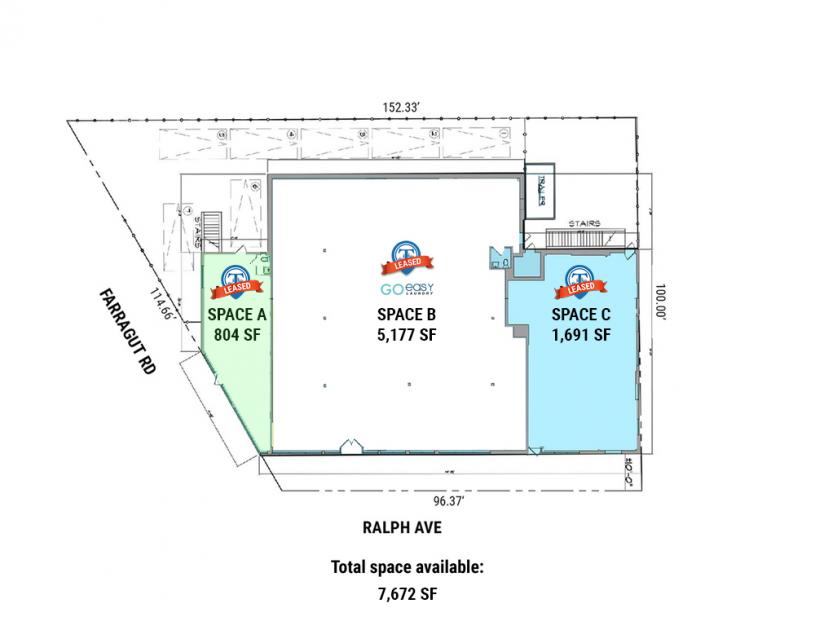
• Fully Stabilized and renovated one story commercial property consisting of 3 retail and office tenants.
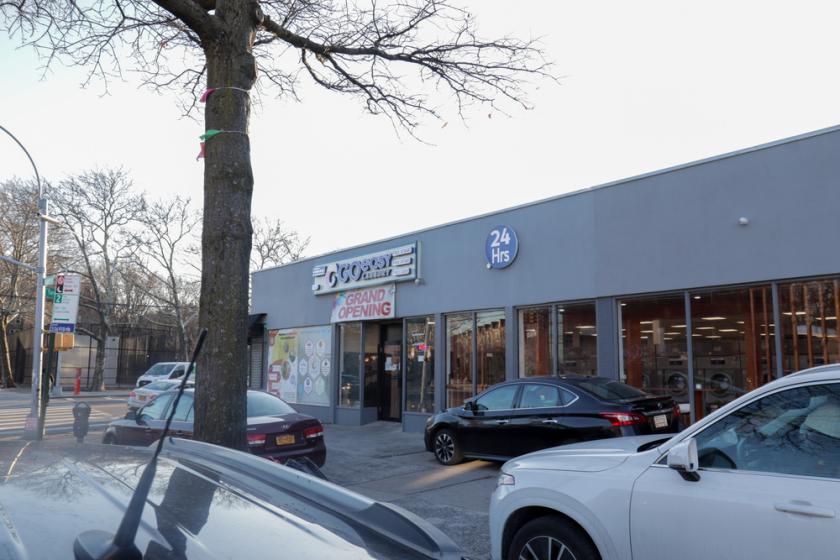
• The Laundromat was there for over 25 years, recently went through gut renovation.
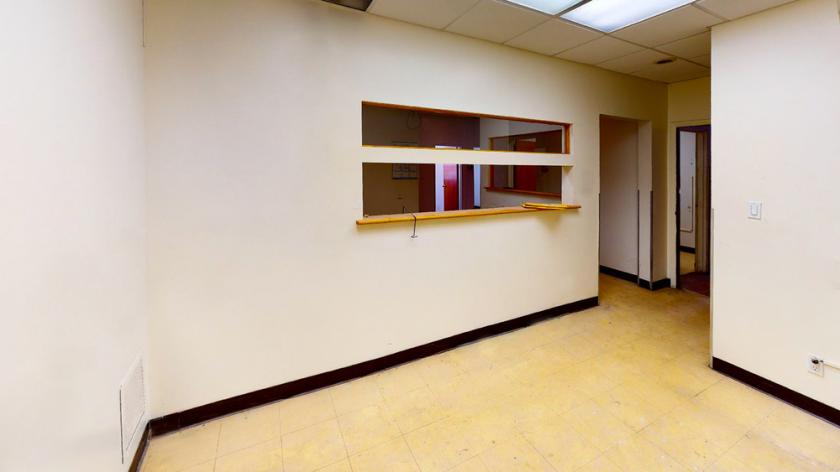
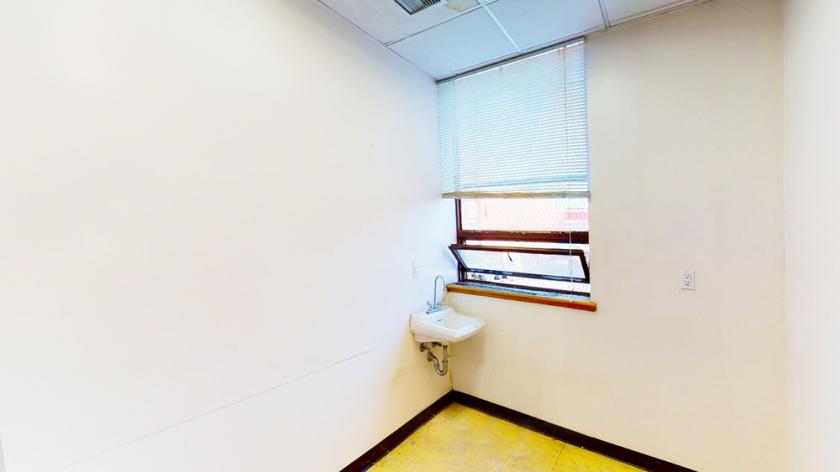
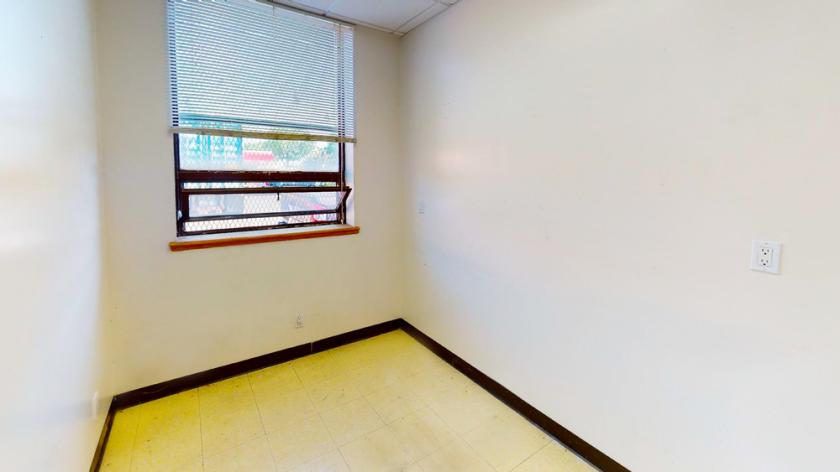
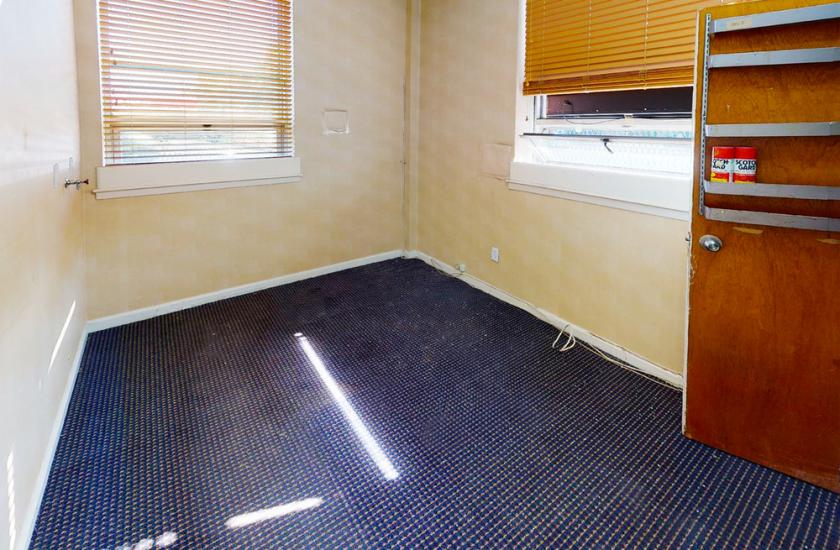
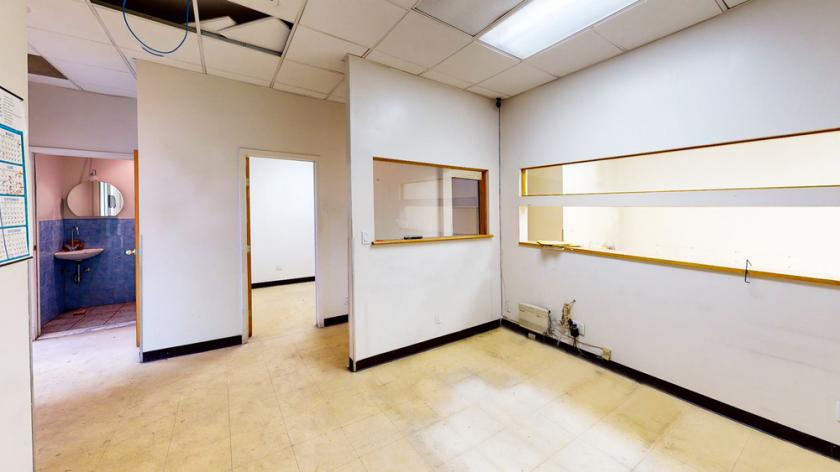
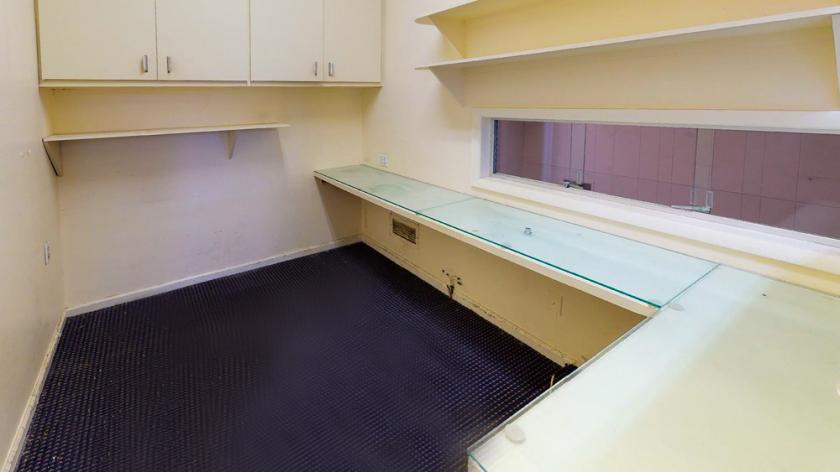
Additional Photos

Listing Agents

Shlomi Bagdadi
O: 718-437-6100
info@tristatecr.com
O: 718-437-6100
info@tristatecr.com
While we strive to provide the most accurate information, all listing information, and demographic data, is provided by third-parties. As such, MyEListing will not be responsible for the accuracy of the information. It is strongly recommended that you verify all information with the listing agent, and any relevant agencies, prior to making any decisions.