Commercial Land
2260 West Sandtown Road Southwest Marietta, GA 30064
2260 West Sandtown Road Southwest Marietta, GA 30064
Details & Description
Property Highlights
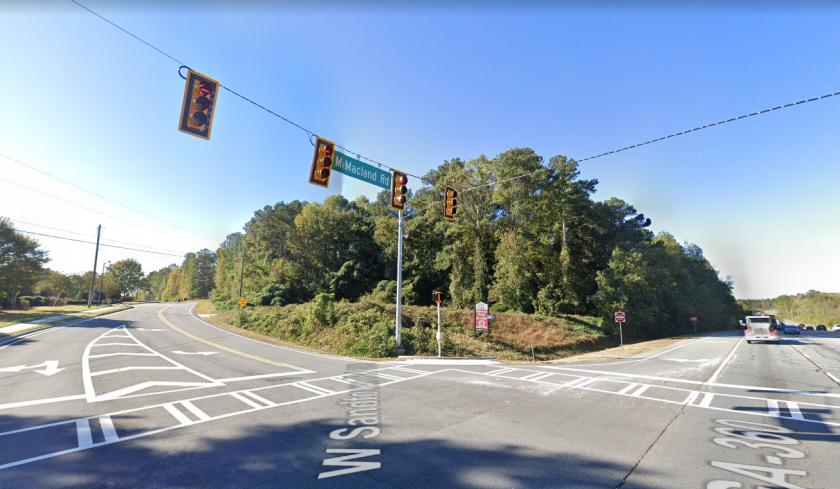
- • Pin corner of signalized intersection
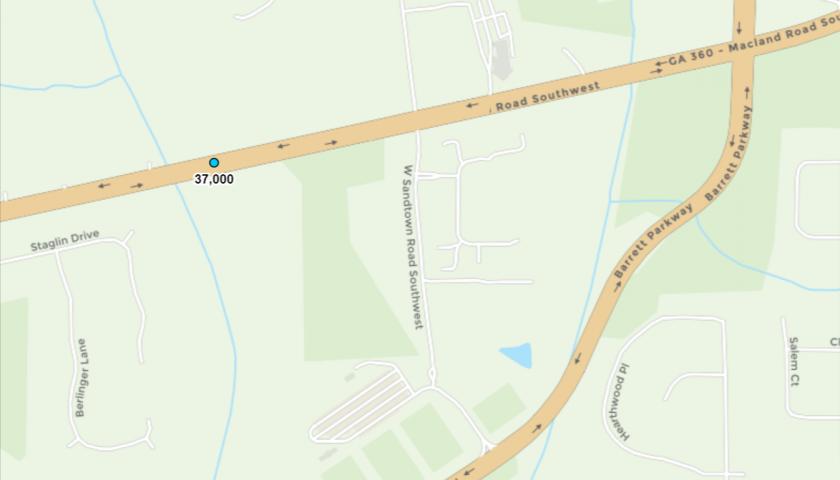
- • 37,000 traffic count on going to work side
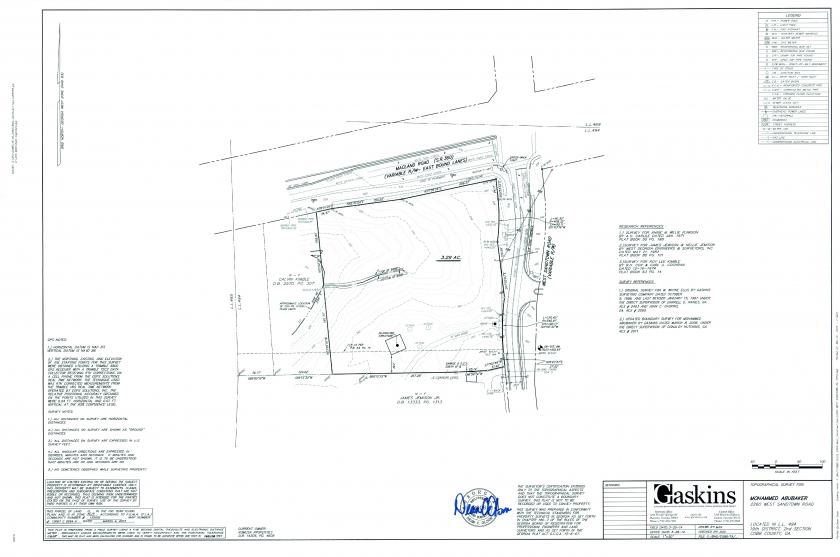
- • 3 acres with additional acreage available
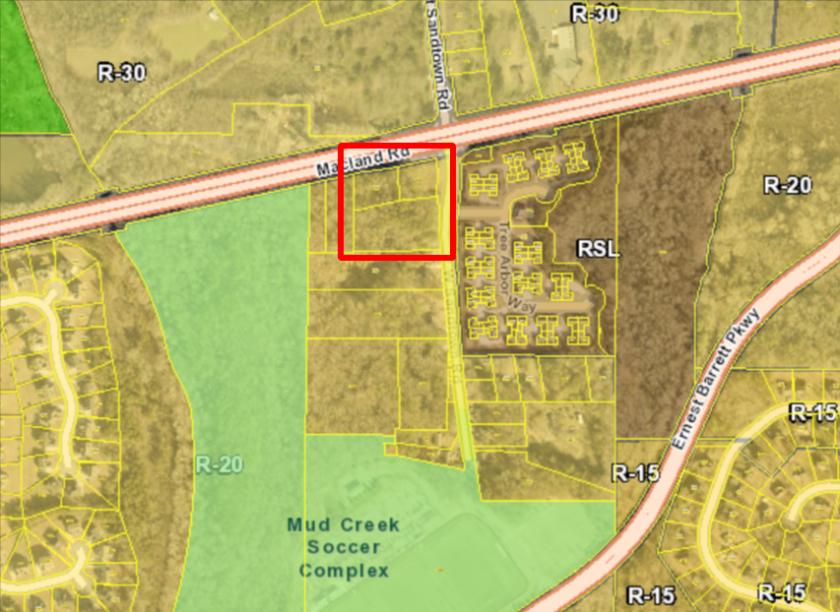
- • Strong growth area with attractive demographics
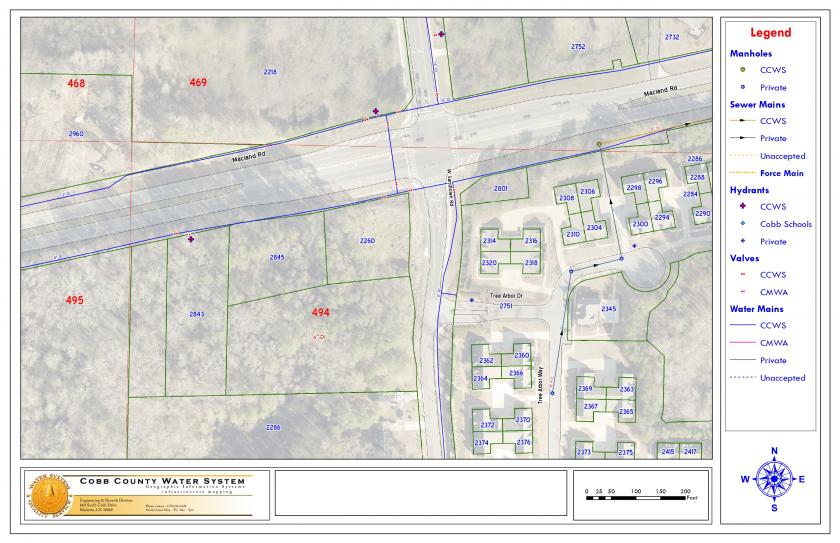
- • All utilities on site
- • County open to NRC or OI uses
Additional Photos
Listing Agents

Kylee Warshaw
O: 678-631-1700
M: 678-472-6847
kylee@wnkproperties.com
O: 678-631-1700
M: 678-472-6847
kylee@wnkproperties.com

Jim Deville
KW Commercial
O: 770-480-2186
jimdeville@kw.com
KW Commercial
O: 770-480-2186
jimdeville@kw.com
While we strive to provide the most accurate information, all listing information, and demographic data, is provided by third-parties. As such, MyEListing will not be responsible for the accuracy of the information. It is strongly recommended that you verify all information with the listing agent, and any relevant agencies, prior to making any decisions.


