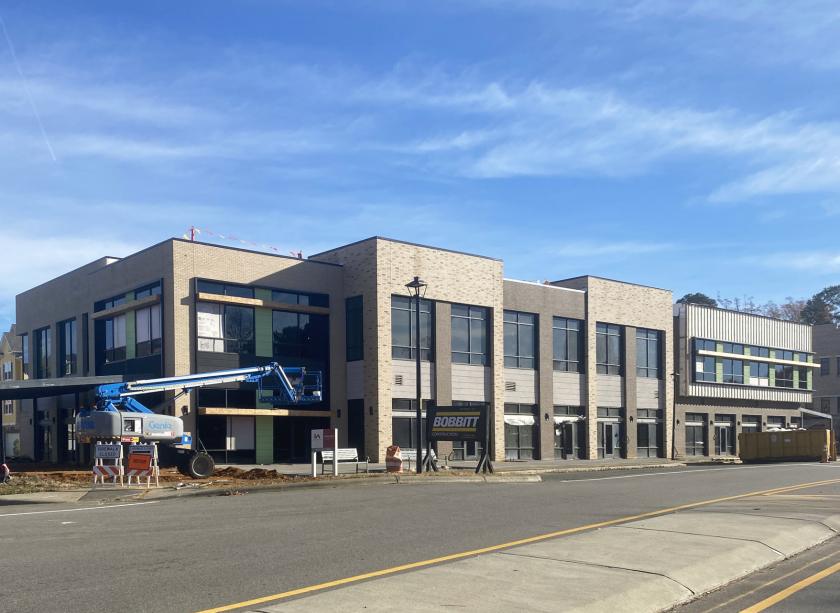
1-Mile | 3-Miles | 5-Miles | ||
---|---|---|---|---|
Total Population | 9,177 | 63,290 | 152,020 | |
Population Median Age | 37 | 37 | 38 | |
Population by Age | 0-9 Yrs | 1250 (13%) | 8455 (13%) | 19821 (13%) |
10-19 Yrs | 1245 (13%) | 9799 (15%) | 22871 (15%) | |
20-29 Yrs | 985 (10%) | 5770 (9%) | 13319 (8%) | |
30-39 Yrs | 1190 (12%) | 8095 (12%) | 20007 (13%) | |
40-49 Yrs | 1695 (18%) | 11943 (18%) | 27231 (17%) | |
50-59 Yrs | 1419 (15%) | 10145 (16%) | 23318 (15%) | |
60-69 Yrs | 766 (8%) | 5217 (8%) | 13903 (9%) | |
70+ Yrs | 628 (6%) | 3867 (6%) | 11550 (7%) | |
Median HH Income | $99,132 | $111,012 | $109,792 | |
Total Household Income | < 24K | 228 (6%) | 1525 (6%) | 4128 (7%) |
25-49K | 384 (11%) | 2306 (10%) | 5875 (10%) | |
50-74K | 521 (15%) | 2996 (13%) | 7783 (13%) | |
75-99K | 552 (16%) | 3211 (14%) | 7361 (13%) | |
100-199K | 1228 (36%) | 8975 (39%) | 20637 (37%) | |
200K+ | 419 (12%) | 3546 (15%) | 9845 (17%) | |
Highest Education Level | No Diploma | 329 | 1618 | 3845 |
Diploma or GED | 681 | 4244 | 9991 | |
Some College | 852 | 5548 | 13396 | |
Assoc. Degree | 488 | 3578 | 7957 | |
Bachelors Degree | 2084 | 16226 | 39823 | |
Higher Degree | 1684 | 11204 | 28595 | |
Total Housing Units | 3,489 | 23,370 | 58,196 | |
--Owner-Occupied | 2,388 | 17,836 | 42,317 | |
--Renter-Occupied | 943 | 4,725 | 13,312 | |
Owner-Occupied Values | < 100K | 52 | 283 | 715 |
100-199K | 287 | 1935 | 4511 | |
200-299K | 835 | 5087 | 10990 | |
300-399K | 765 | 5713 | 11937 | |
400-499K | 306 | 2885 | 7187 | |
500K+ | 144 | 1932 | 6976 | |
Total Working Age Population | 7,050 | 48,243 | 116,917 | |
In Work Force | 5,230 | 35,078 | 83,530 | |
Not In Work Force | 1,820 | 13,165 | 33,387 | |
Workforce Employed | 5,091 | 33,810 | 80,609 | |
Workforce Unemployed | 122 | 1,230 | 2,864 | |
Civlian Workforce | 5,213 | 35,040 | 83,473 | |
Military Workforce | 17 | 38 | 57 | |
Total Households | 3,332 | 22,561 | 55,629 | |
Family Households | 2,543 | 17,466 | 42,277 | |
Non-Family Households | 788 | 5,095 | 13,352 | |
Married Couple | 2,084 | 14,621 | 35,627 | |
Other Family | 459 | 2,845 | 6,649 | |
Married w/Child | 1,055 | 7,750 | 18,237 | |
Single Male w/Child | 91 | 468 | 1,026 | |
Single Female w/Child | 150 | 1,317 | 2,901 |
Population Change Last Two Decades - Plus Projection
2000 | % | 2010 | % | 2020 | % | 2030 | |
---|---|---|---|---|---|---|---|
North Carolina | 8,049,313 | +18 | 9,535,483 | +11 | 10,630,691 | +11 | 11,836,070 |
Wake County | 627,846 | +44 | 900,993 | +23 | 1,109,883 | +20 | 1,328,336 |
Total Working Age Population:
Total Households:
Total Working Age Population:
Total Households:
Total Working Age Population:
Total Households: