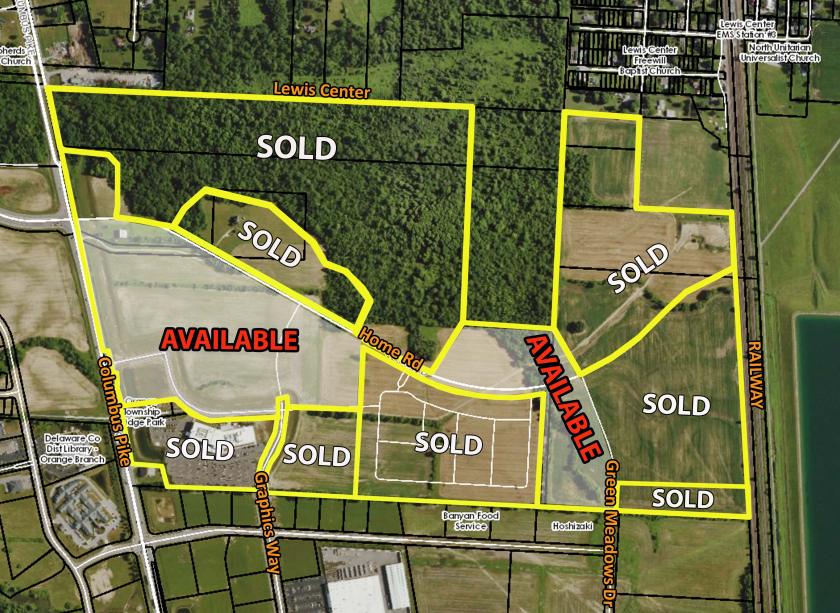
1-Mile | 3-Miles | 5-Miles | ||
---|---|---|---|---|
Total Population | 2,257 | 28,849 | 90,807 | |
Population Median Age | 36 | 34 | 35 | |
Population by Age | 0-9 Yrs | 398 (17%) | 4903 (16%) | 13909 (15%) |
10-19 Yrs | 339 (15%) | 4720 (16%) | 14011 (15%) | |
20-29 Yrs | 172 (7%) | 2506 (8%) | 9038 (9%) | |
30-39 Yrs | 341 (15%) | 4153 (14%) | 13853 (15%) | |
40-49 Yrs | 375 (16%) | 5350 (18%) | 15483 (17%) | |
50-59 Yrs | 232 (10%) | 3325 (11%) | 11373 (12%) | |
60-69 Yrs | 167 (7%) | 2251 (7%) | 7220 (7%) | |
70+ Yrs | 234 (10%) | 1641 (5%) | 5919 (6%) | |
Median HH Income | $127,231 | $130,926 | $117,556 | |
Total Household Income | < 24K | 46 (5%) | 361 (3%) | 1520 (4%) |
25-49K | 103 (13%) | 1037 (10%) | 3396 (10%) | |
50-74K | 61 (7%) | 929 (9%) | 4083 (12%) | |
75-99K | 91 (11%) | 980 (10%) | 4203 (13%) | |
100-199K | 285 (36%) | 4007 (42%) | 12086 (37%) | |
200K+ | 196 (25%) | 2215 (23%) | 6634 (20%) | |
Highest Education Level | No Diploma | 40 | 378 | 1247 |
Diploma or GED | 115 | 1581 | 7213 | |
Some College | 222 | 2694 | 8887 | |
Assoc. Degree | 89 | 1057 | 3482 | |
Bachelors Degree | 564 | 7195 | 22712 | |
Higher Degree | 378 | 4930 | 15054 | |
Total Housing Units | 822 | 9,877 | 33,471 | |
--Owner-Occupied | 726 | 8,430 | 24,645 | |
--Renter-Occupied | 55 | 1,099 | 7,276 | |
Owner-Occupied Values | < 100K | 10 | 109 | 517 |
100-199K | 30 | 618 | 2910 | |
200-299K | 141 | 2376 | 6374 | |
300-399K | 221 | 2845 | 7318 | |
400-499K | 209 | 1307 | 3903 | |
500K+ | 113 | 1175 | 3622 | |
Total Working Age Population | 1,605 | 20,690 | 67,487 | |
In Work Force | 1,025 | 15,078 | 49,378 | |
Not In Work Force | 580 | 5,611 | 18,109 | |
Workforce Employed | 960 | 14,623 | 48,070 | |
Workforce Unemployed | 65 | 446 | 1,259 | |
Civlian Workforce | 1,025 | 15,070 | 49,329 | |
Military Workforce | 0 | 9 | 49 | |
Total Households | 781 | 9,529 | 31,921 | |
Family Households | 604 | 7,973 | 24,398 | |
Non-Family Households | 177 | 1,556 | 7,523 | |
Married Couple | 539 | 6,979 | 21,090 | |
Other Family | 65 | 994 | 3,309 | |
Married w/Child | 351 | 4,343 | 12,210 | |
Single Male w/Child | 31 | 203 | 562 | |
Single Female w/Child | 19 | 493 | 1,490 |
Population Change Last Two Decades - Plus Projection
2000 | % | 2010 | % | 2020 | % | 2030 | |
---|---|---|---|---|---|---|---|
Ohio | 11,353,140 | +2 | 11,536,504 | 0 | 11,574,870 | 0 | 11,615,100 |
Delaware County | 109,989 | +58 | 174,214 | +21 | 210,630 | +17 | 246,000 |
Franklin County | 1,068,978 | +9 | 1,163,414 | +11 | 1,291,320 | +8 | 1,394,980 |
Total Working Age Population:
Total Households:
Total Working Age Population:
Total Households:
Total Working Age Population:
Total Households: