Retail Space
6615 Falls of Neuse Road Raleigh, NC 27615
6615 Falls of Neuse Road Raleigh, NC 27615
Details & Description
Property Highlights
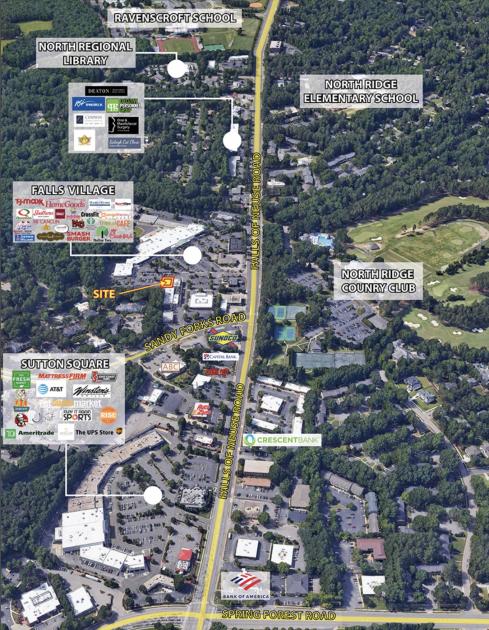
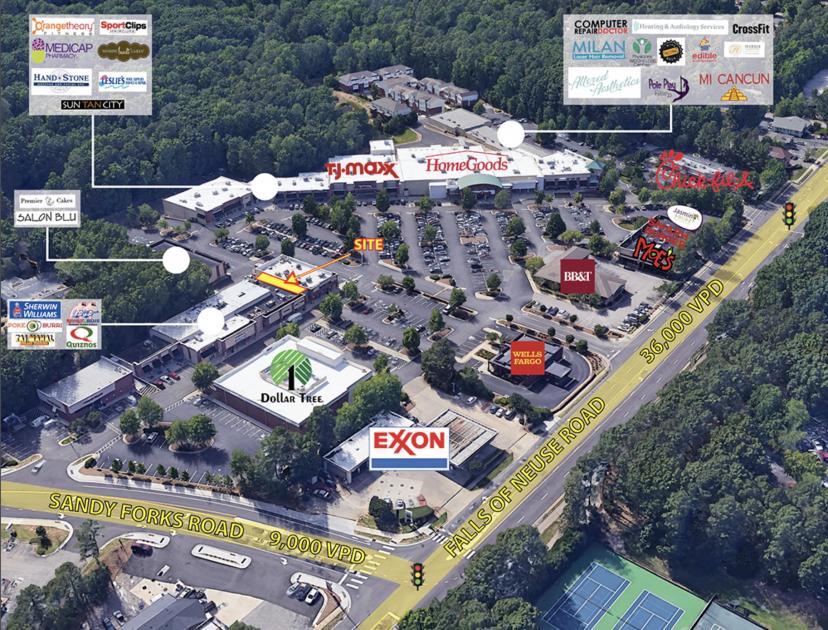
• Traffic counts 36,000 VPD on Falls of Neuse Road 9,000 VPD on Sandy Forks Road
• Multiple entrances including signalized entrance on Falls of Neuse Road
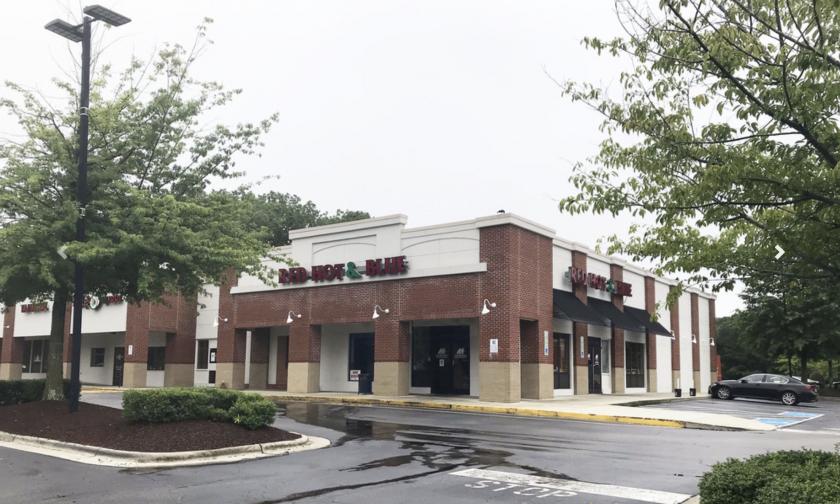
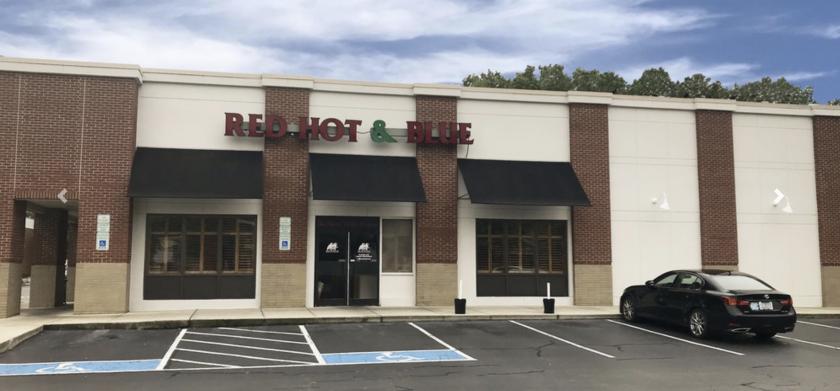
Additional Photos
Listing Agents

Carla Trepper
Lee and Associates
O: 919-576-2516
M: 919-625-4656
ctrepper@lee-associates.com
Lee and Associates
O: 919-576-2516
M: 919-625-4656
ctrepper@lee-associates.com
While we strive to provide the most accurate information, all listing information, and demographic data, is provided by third-parties. As such, MyEListing will not be responsible for the accuracy of the information. It is strongly recommended that you verify all information with the listing agent, and any relevant agencies, prior to making any decisions.


