Retail Space
4031 Wake Forest Road Raleigh, NC 27609
4031 Wake Forest Road Raleigh, NC 27609

Details & Description
Property Highlights
- • Suite 4025
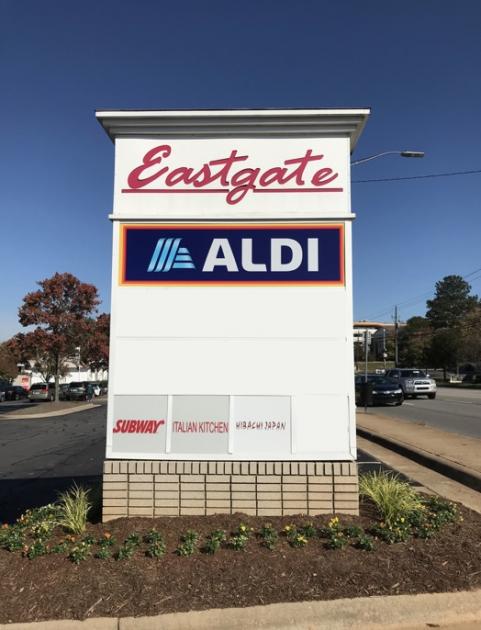
- • Good mix of national and regional tenants
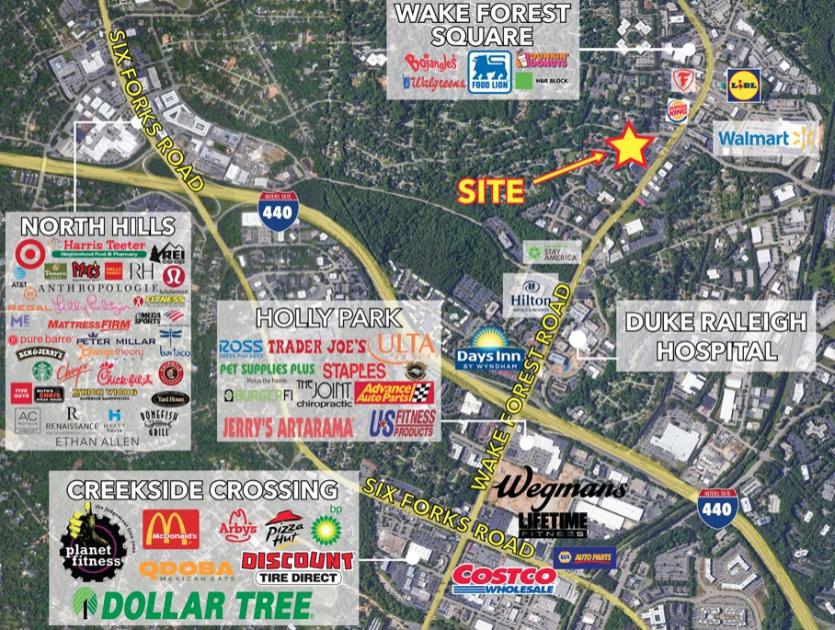
- • Traffic counts 44,000 VPD on Wake Forest Road
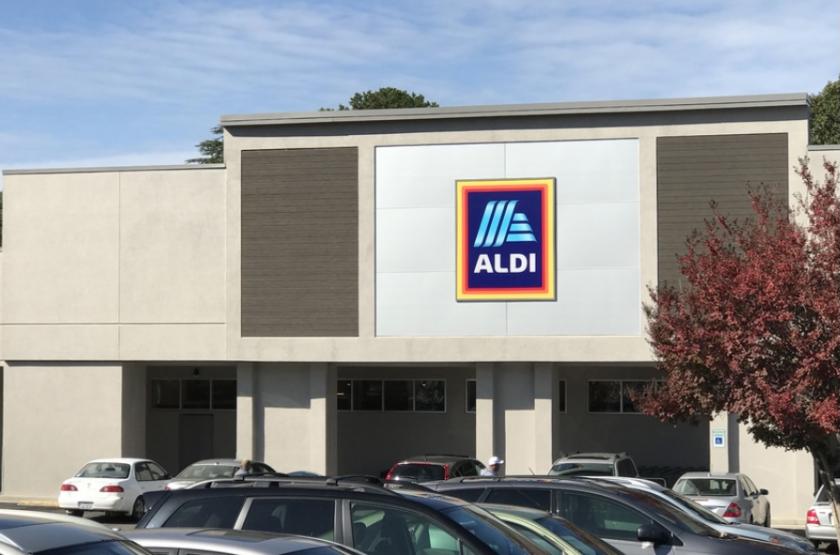
- • Anchored by Aldi
Additional Photos
Listing Agents

Moss Withers
O: 919-576-2501
M: 919-810-2492
mwithers@lee-associates.com
O: 919-576-2501
M: 919-810-2492
mwithers@lee-associates.com
While we strive to provide the most accurate information, all listing information, and demographic data, is provided by third-parties. As such, MyEListing will not be responsible for the accuracy of the information. It is strongly recommended that you verify all information with the listing agent, and any relevant agencies, prior to making any decisions.


