Office Space
3402 Kildaire Farm Road Cary, NC 27518
3402 Kildaire Farm Road Cary, NC 27518

Details & Description
Property Highlights
• Located at the signaled intersection of Kildaire Farm Rd. with approx. 23,000 VPD and Ten-Ten Rd. with approx. 17,000 V
• Surrounding tenants include Publix, Starbucks, McDonalds, Jersey Mikes, Walgreens, CVS, Dunkin Donuts
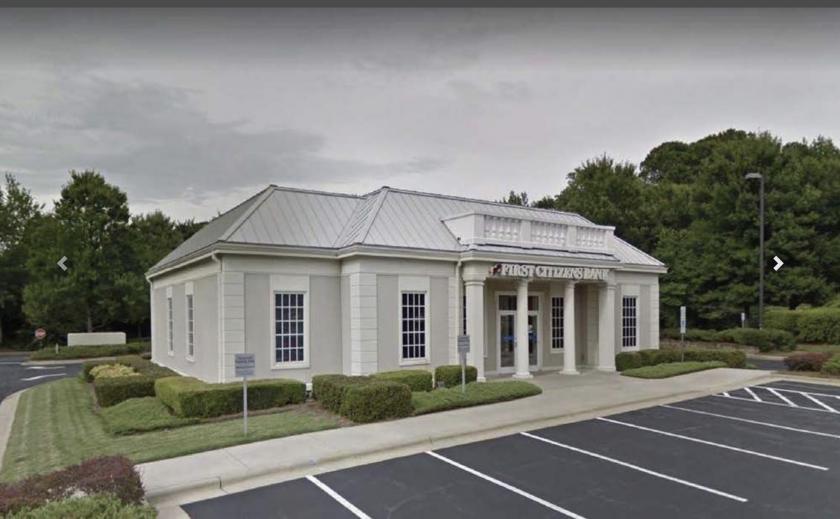
Additional Photos


Listing Agents

James Bailey
O: 919-576-2514
M: 336-602-3022
jbailey@lee-associates.com
O: 919-576-2514
M: 336-602-3022
jbailey@lee-associates.com
While we strive to provide the most accurate information, all listing information, and demographic data, is provided by third-parties. As such, MyEListing will not be responsible for the accuracy of the information. It is strongly recommended that you verify all information with the listing agent, and any relevant agencies, prior to making any decisions.


