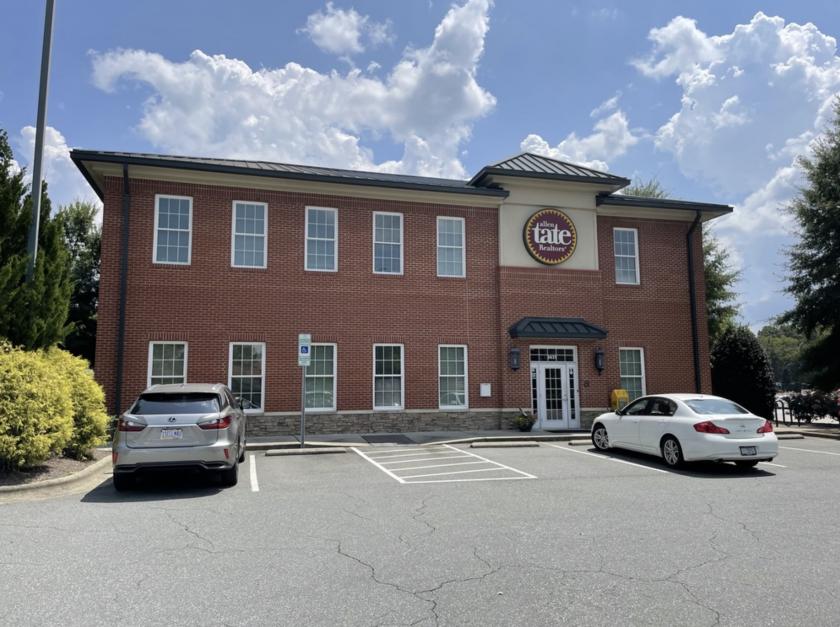
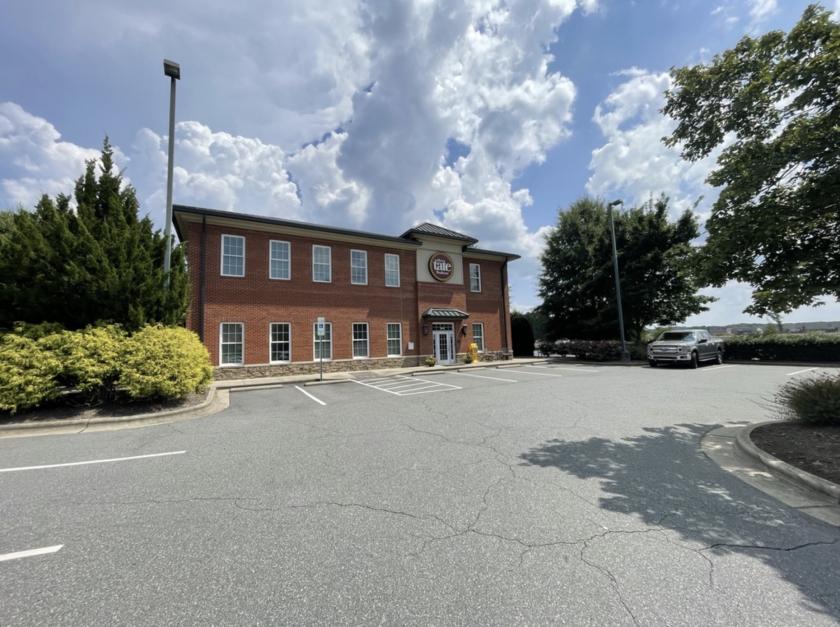
Office Space
3635 Rogers Road Wake Forest, NC 27587
3635 Rogers Road Wake Forest, NC 27587
Details & Description
Property Highlights
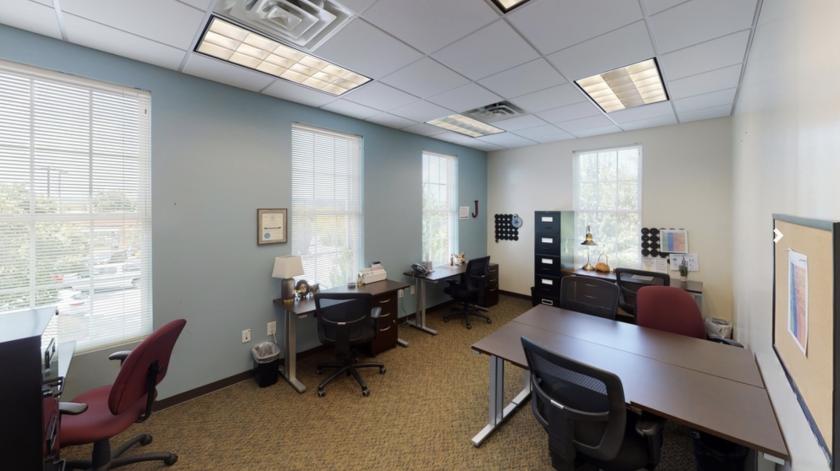
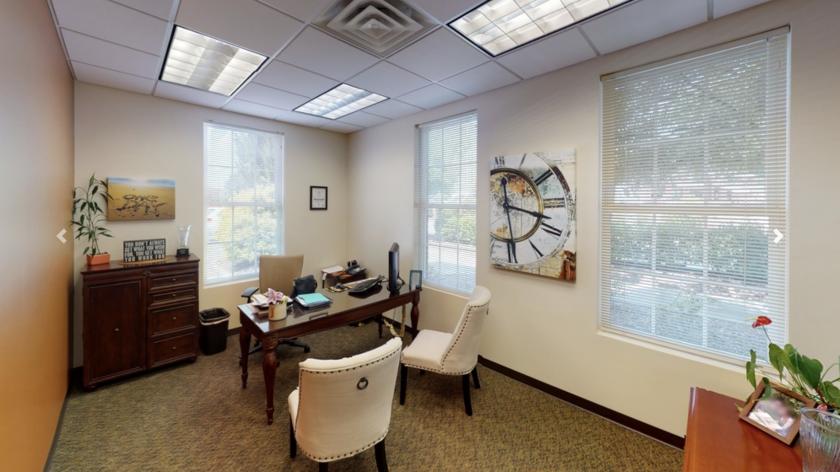
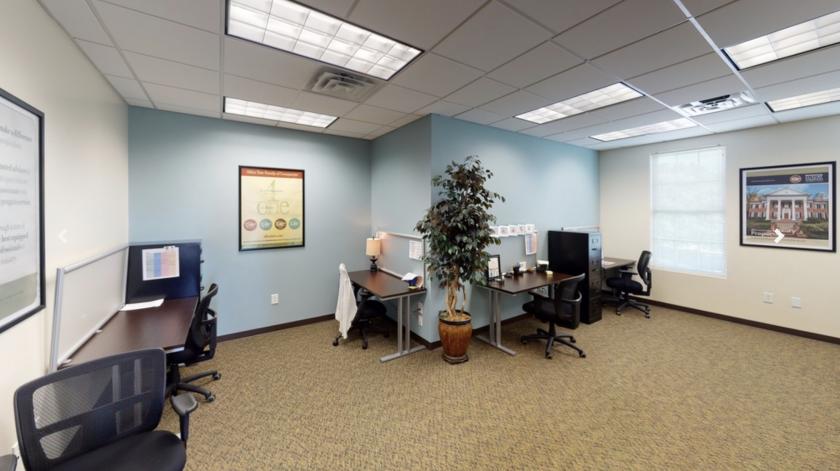
• Approximately 6,448 SF of Class B office space available for lease
• Lease rate $19.50SF, modified gross net of janitorial electric
Additional Photos

Listing Agents

Grier Godwin
Lee and Associates
O: 919-591-2272
M: 919-524-5407
ggodwin@lee-associates.com
Lee and Associates
O: 919-591-2272
M: 919-524-5407
ggodwin@lee-associates.com

Jake Plotkin
O: 919-576-2505
M: 919-616-0066
jplotkin@lee-associates.com
O: 919-576-2505
M: 919-616-0066
jplotkin@lee-associates.com
While we strive to provide the most accurate information, all listing information, and demographic data, is provided by third-parties. As such, MyEListing will not be responsible for the accuracy of the information. It is strongly recommended that you verify all information with the listing agent, and any relevant agencies, prior to making any decisions.