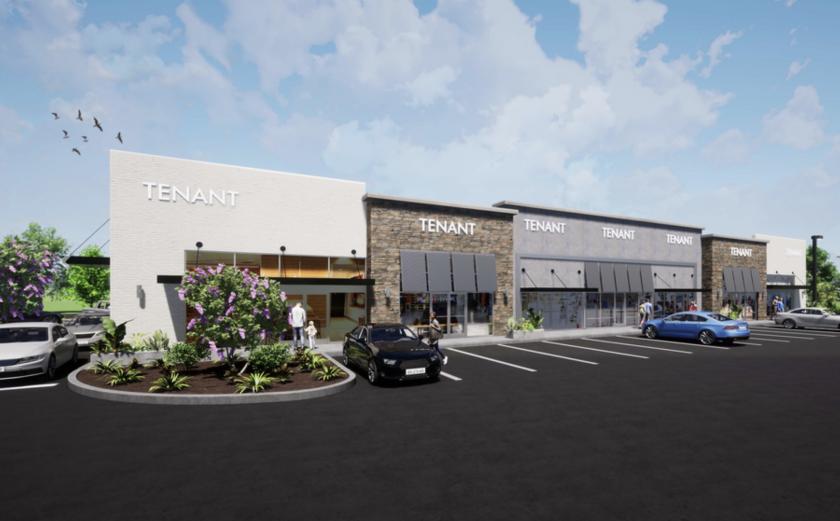
Retail Space
Northwood High School Rd. Pittsboro, NC 27312
Northwood High School Rd. Pittsboro, NC 27312
Details & Description
Property Highlights
- • 9,600 SF retail building proposed
- • Lowes Foods anchored development
- • Lease rate- $27.50SF, NNN
- • Proposed parking- 64 spaces total
- • TICAM- $5.00
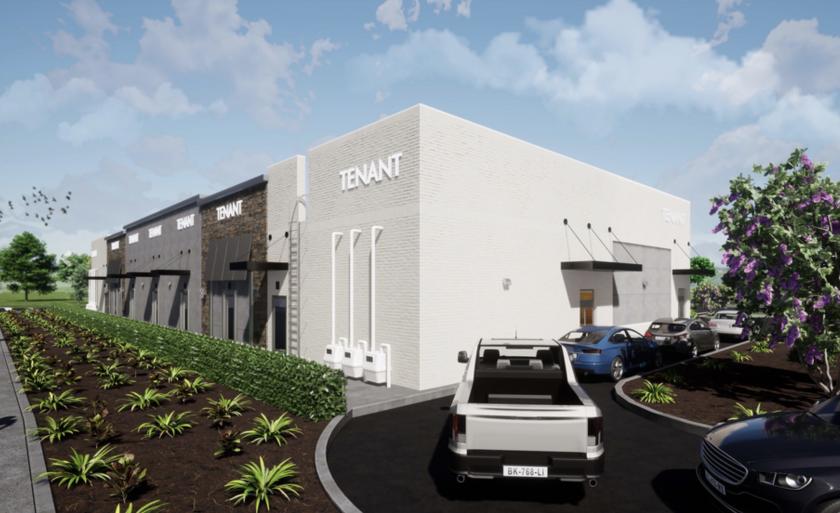
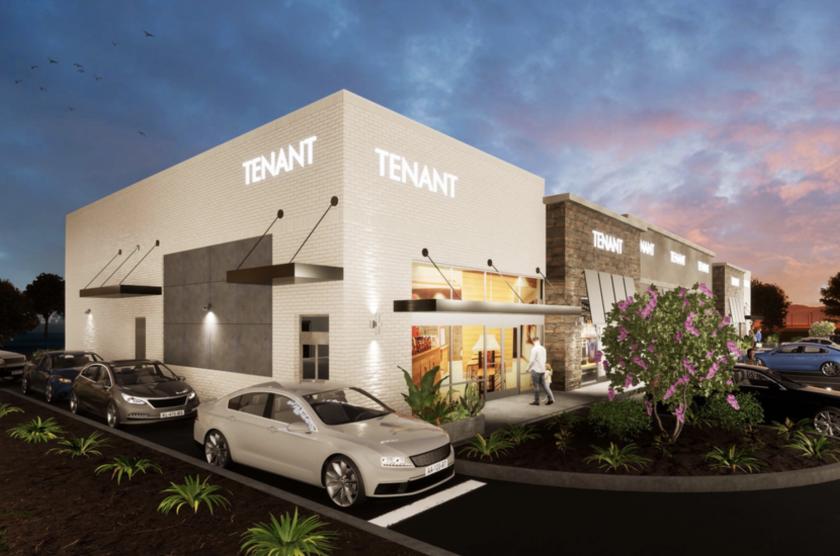
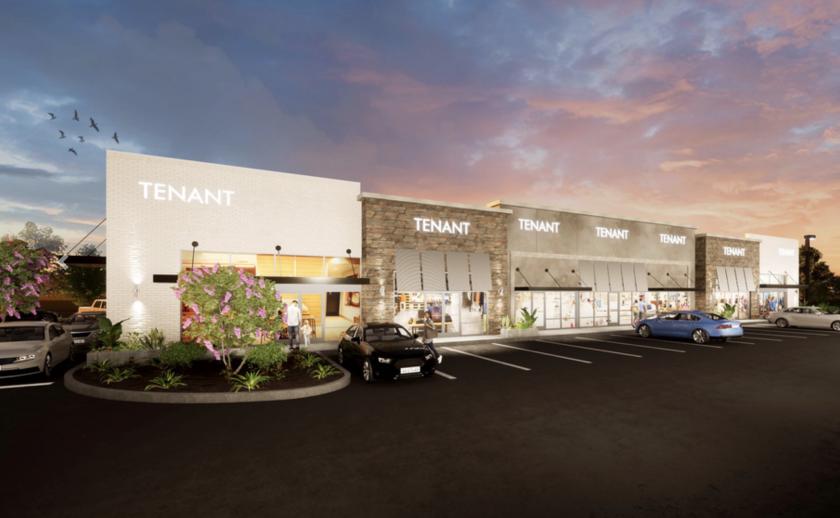
Additional Photos

Listing Agents

Hunter Stewart
O: 919-576-2507
M: 919-548-3172
hstewart@lee-associates.com
O: 919-576-2507
M: 919-548-3172
hstewart@lee-associates.com

Cole Pennell
O: 919-591-2270
M: 704-975-0164
cpennell@lee-associates.com
O: 919-591-2270
M: 704-975-0164
cpennell@lee-associates.com

Moss Withers
O: 919-576-2501
M: 919-810-2492
mwithers@lee-associates.com
O: 919-576-2501
M: 919-810-2492
mwithers@lee-associates.com
While we strive to provide the most accurate information, all listing information, and demographic data, is provided by third-parties. As such, MyEListing will not be responsible for the accuracy of the information. It is strongly recommended that you verify all information with the listing agent, and any relevant agencies, prior to making any decisions.


