Retail Space
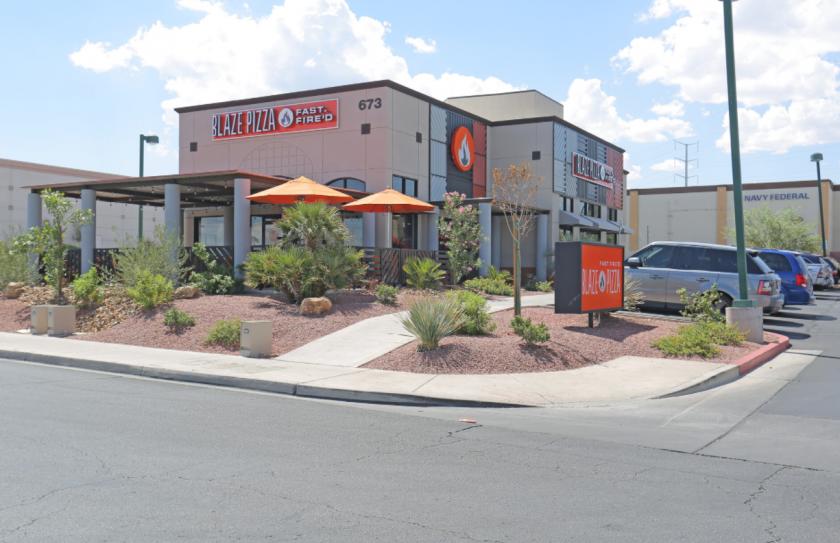
673 Mall Ring Circle Henderson, NV 89014
673 Mall Ring Circle Henderson, NV 89014
Details & Description
Property Highlights
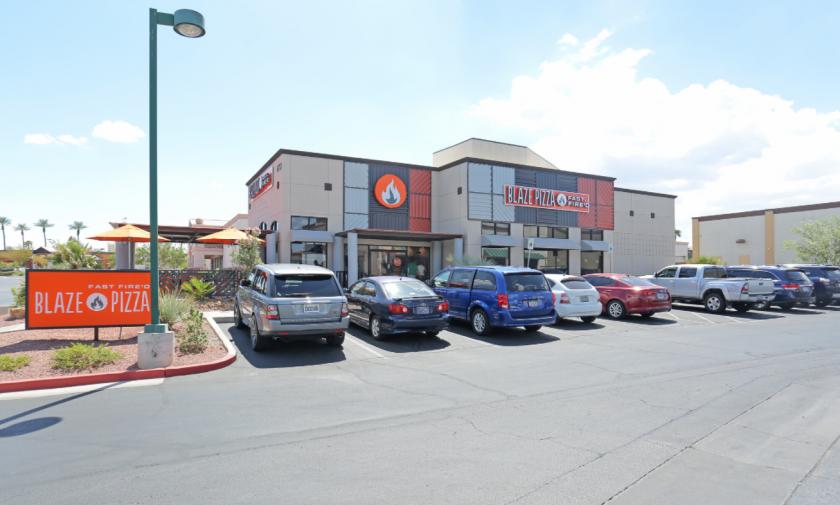
- • Pad building outside Sunset Galleria Mall
- • Fully remodeled in 2016 new roof and HVAC
- • Strong Franchisee 12 Blaze Pizza Locations
- • Above the AUV Average Unit Volume for Blaze Pizza
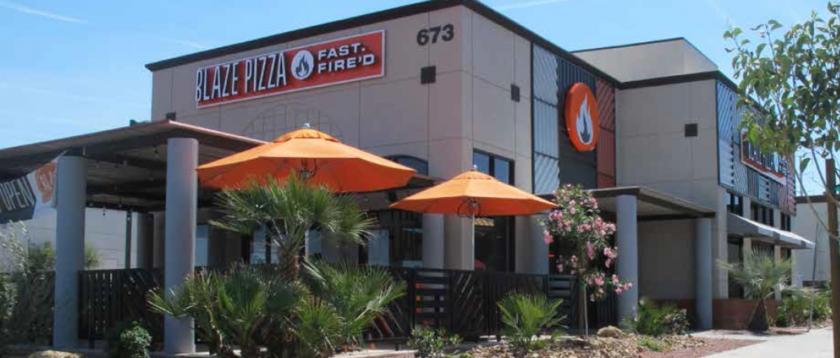
- • Built out patio and deck
- • Three 3 five 5 year options to renew
Additional Photos


Listing Agents

Lisamarie Wand
O: 775-224-5300
lwand@lisamariewand.com
O: 775-224-5300
lwand@lisamariewand.com
While we strive to provide the most accurate information, all listing information, and demographic data, is provided by third-parties. As such, MyEListing will not be responsible for the accuracy of the information. It is strongly recommended that you verify all information with the listing agent, and any relevant agencies, prior to making any decisions.


