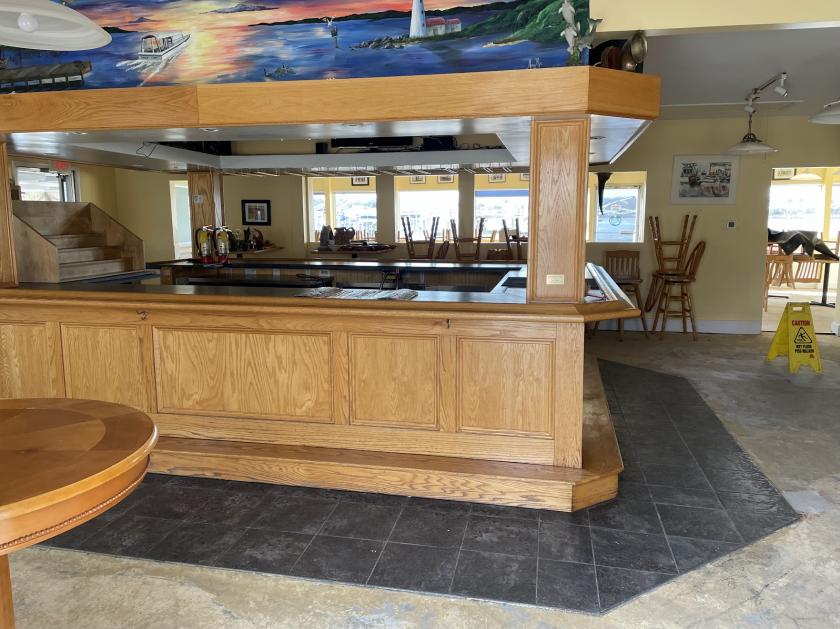
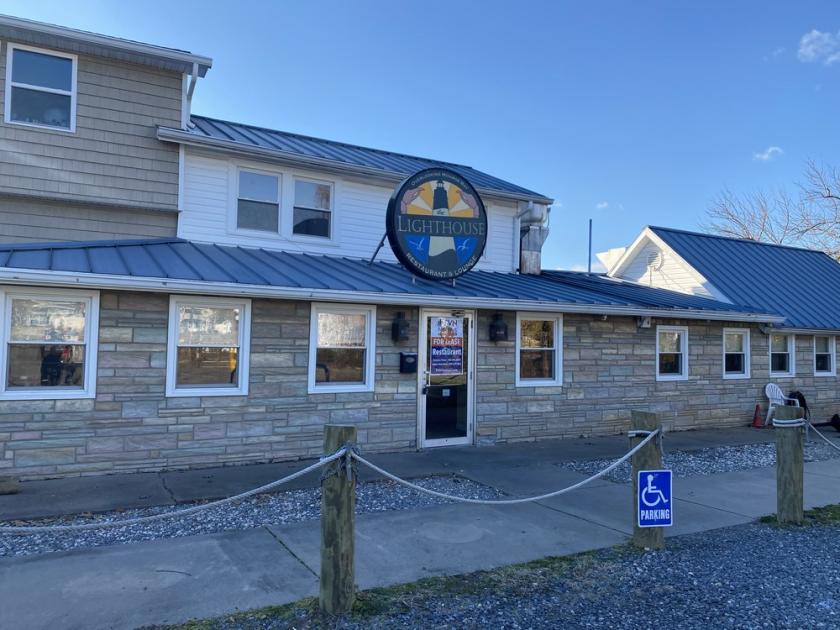
Retail Space
11 Monroe Bay Avenue Colonial Beach, VA 22443
11 Monroe Bay Avenue Colonial Beach, VA 22443
Details & Description
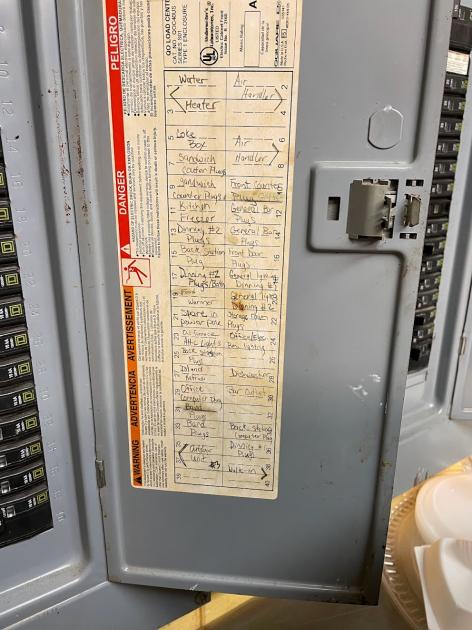
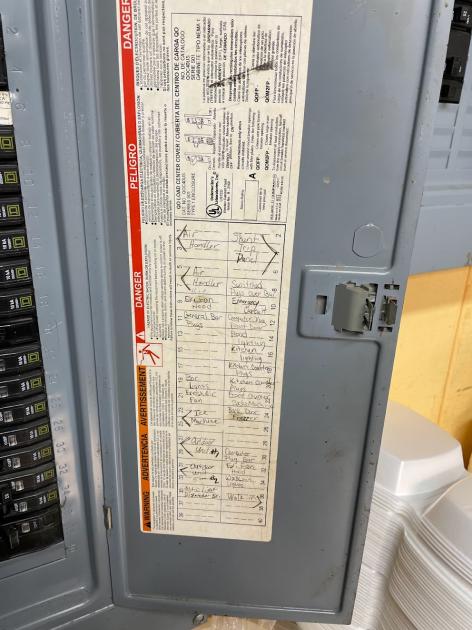
Additional Photos
Listing Agents

Adam Catrambone
M: 804-629-5855
adam.catrambone@svn.com
M: 804-629-5855
adam.catrambone@svn.com
While we strive to provide the most accurate information, all listing information, and demographic data, is provided by third-parties. As such, MyEListing will not be responsible for the accuracy of the information. It is strongly recommended that you verify all information with the listing agent, and any relevant agencies, prior to making any decisions.