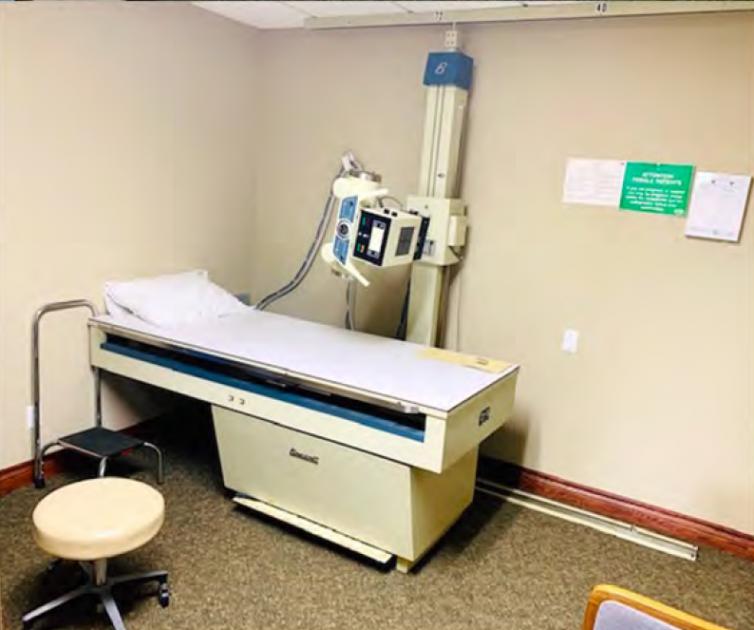
Health Care and Medical Properties
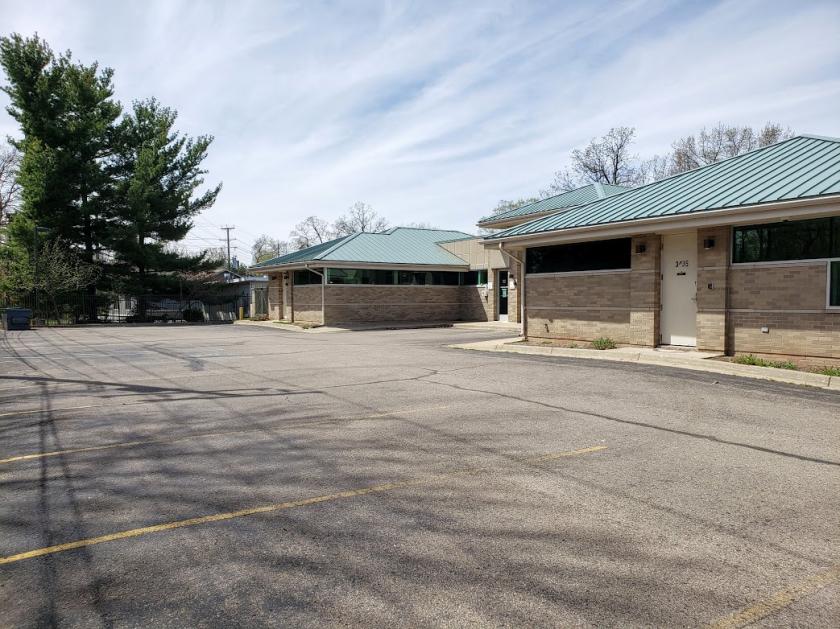
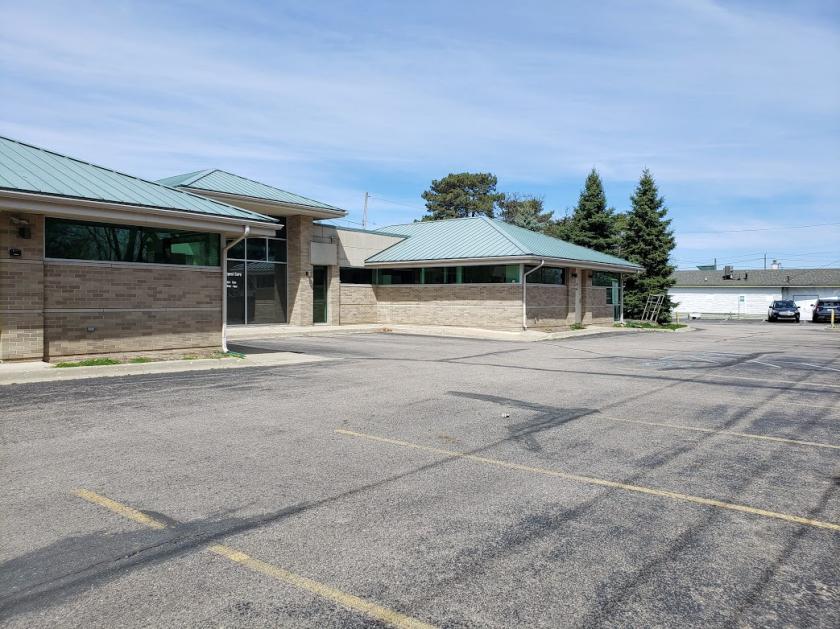
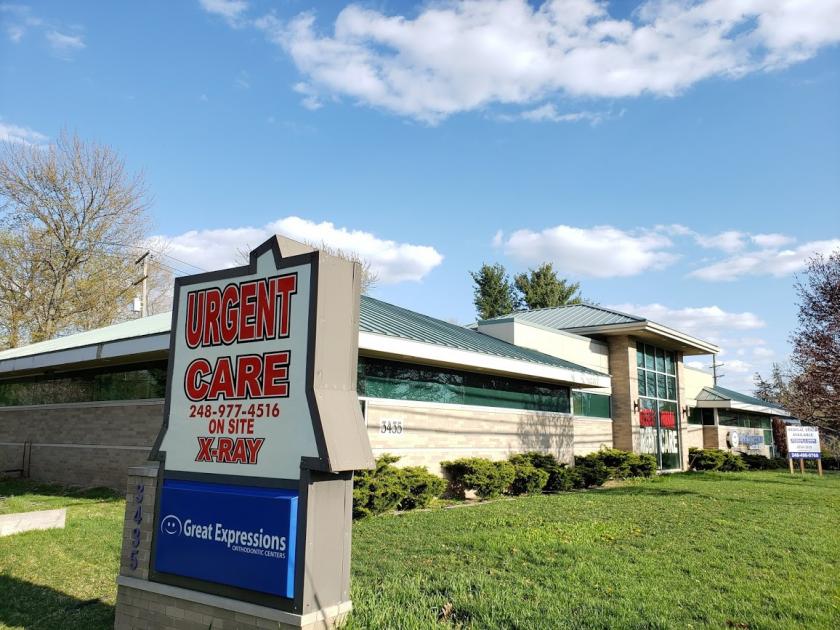
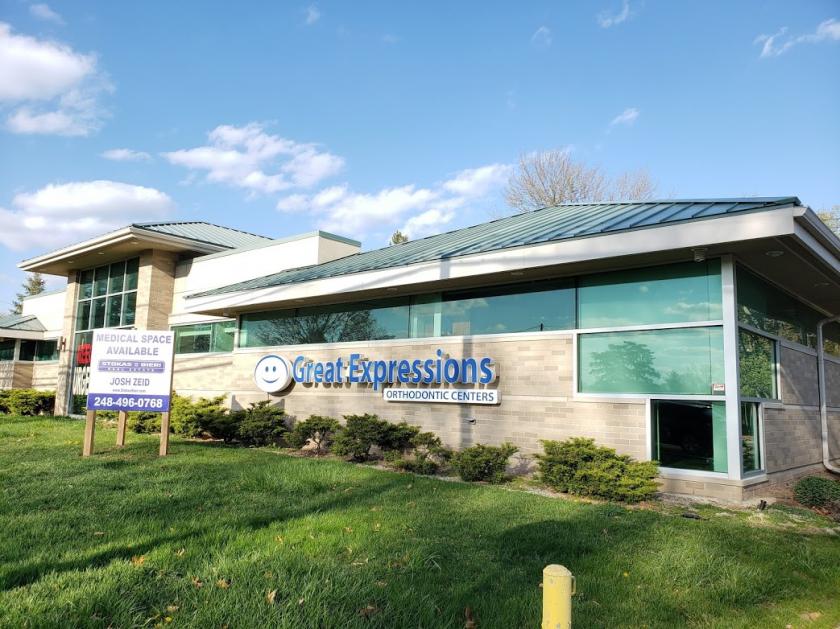
3435 Orchard Lake Road Keego Harbor, MI 48320
3435 Orchard Lake Road Keego Harbor, MI 48320
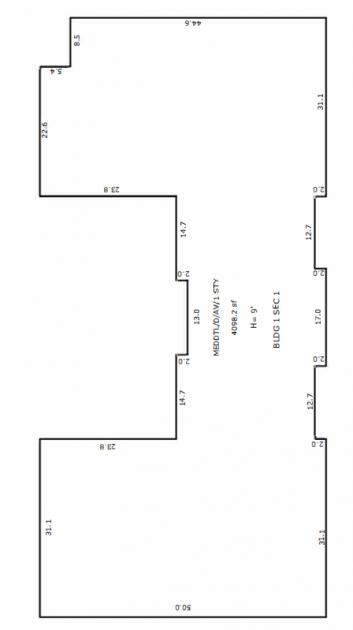
Details & Description
Property Highlights
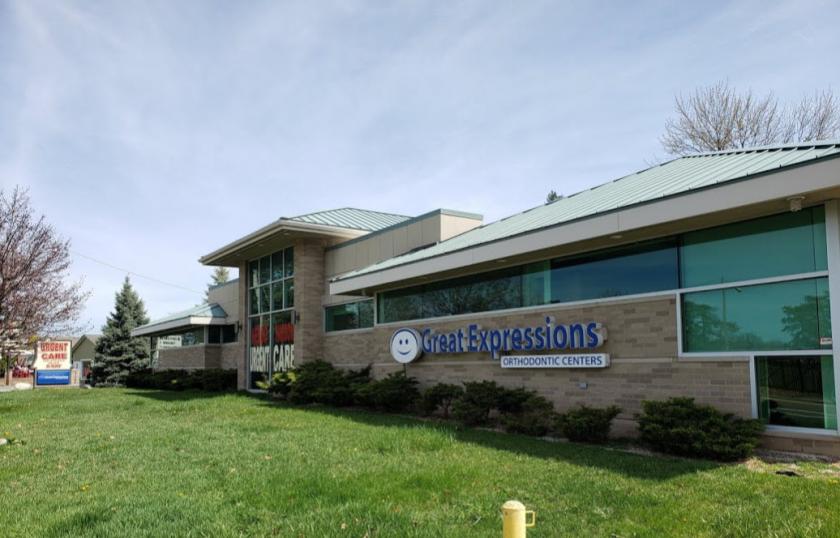
- • High visibility signage on Orchard Lake Rd
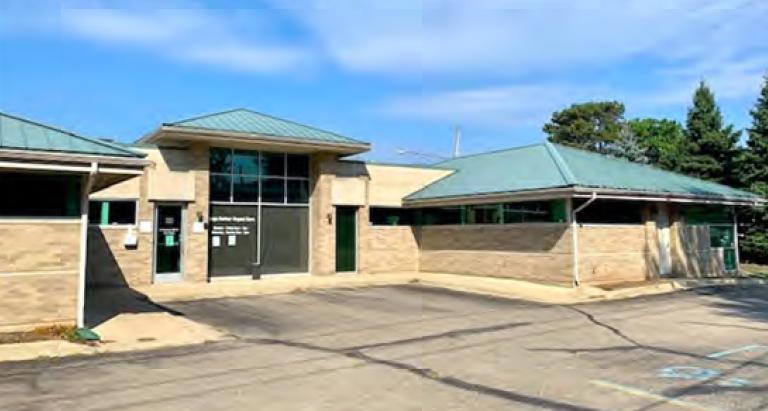
- • Ample parking in dedicated lot
- • Full building generator
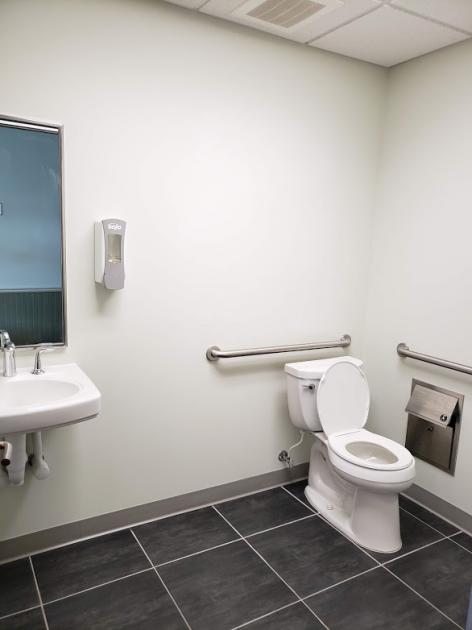
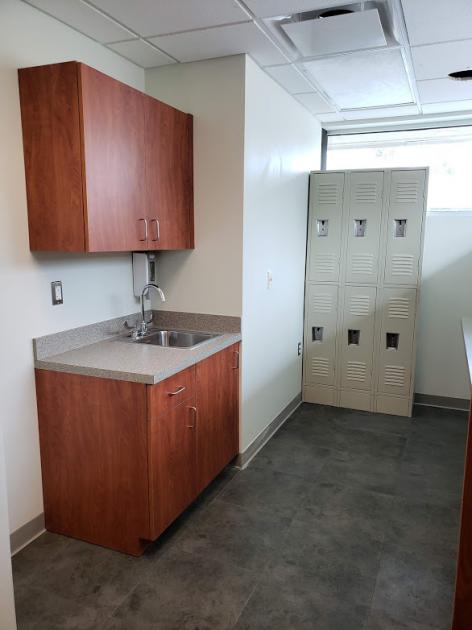
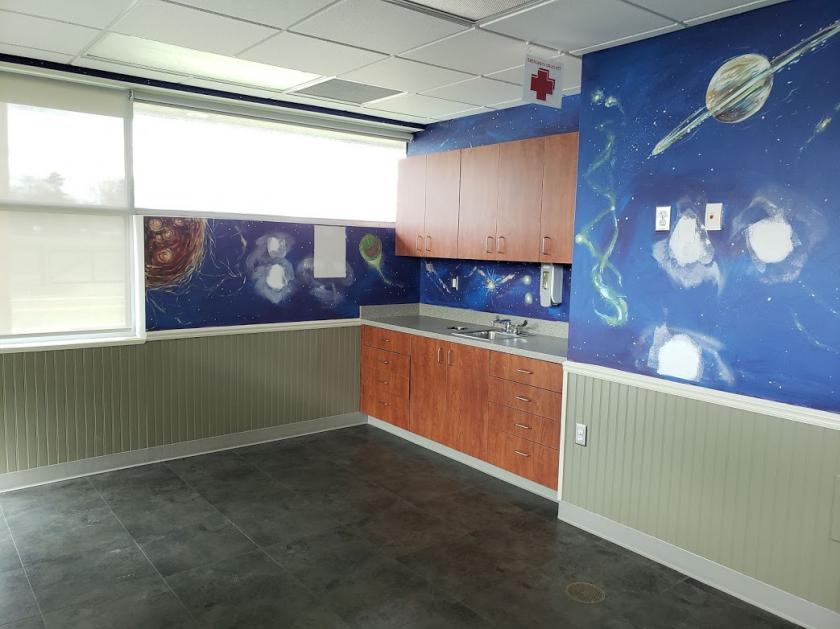
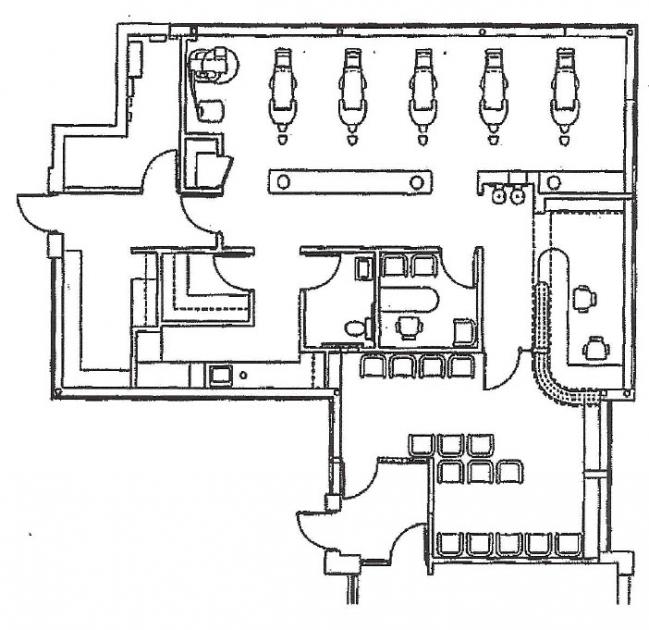
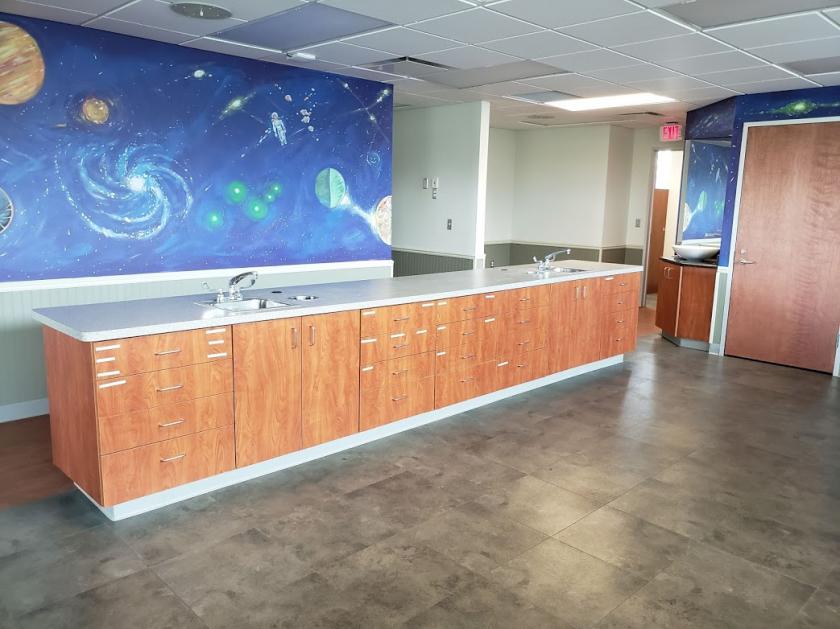
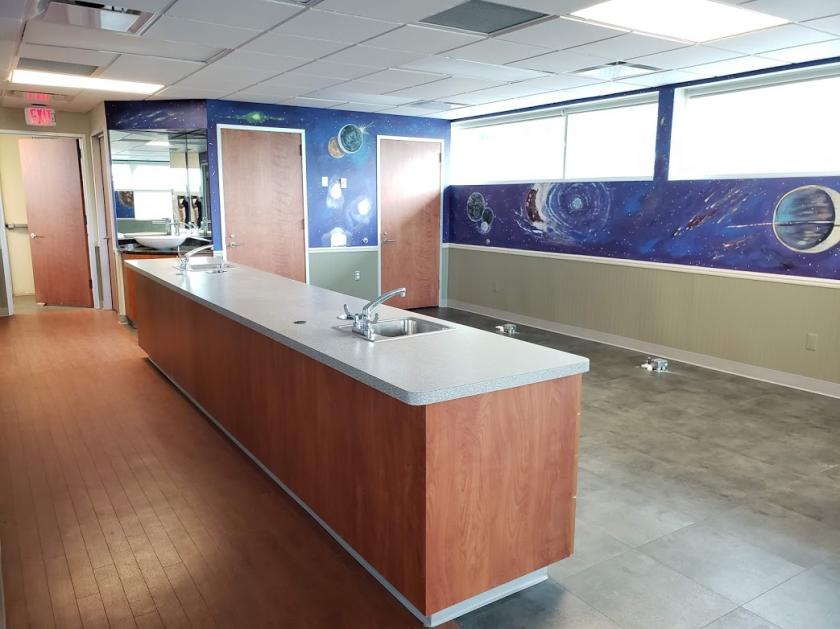
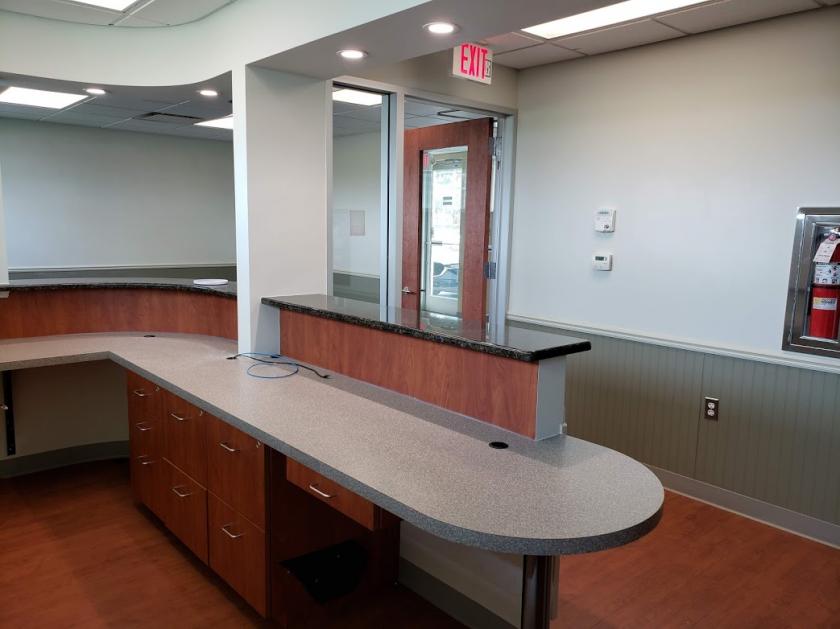
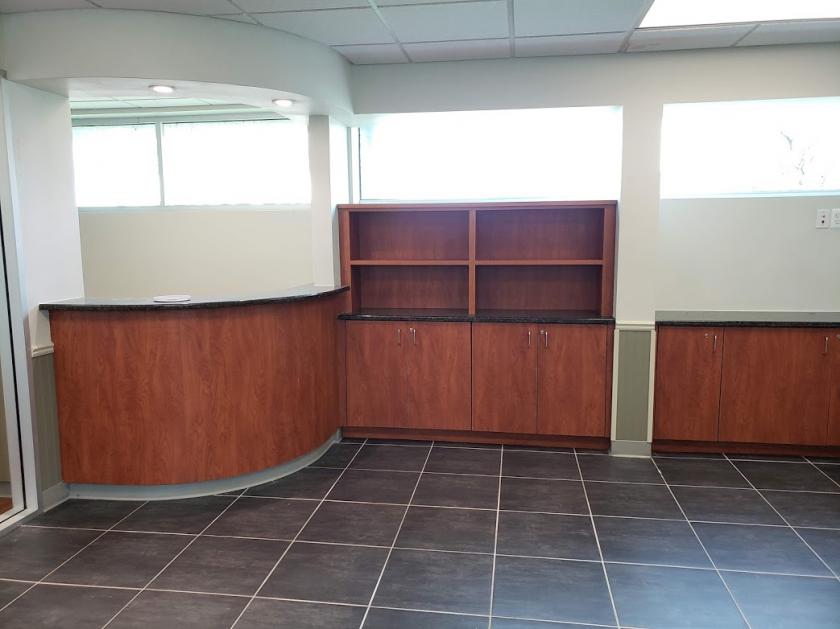
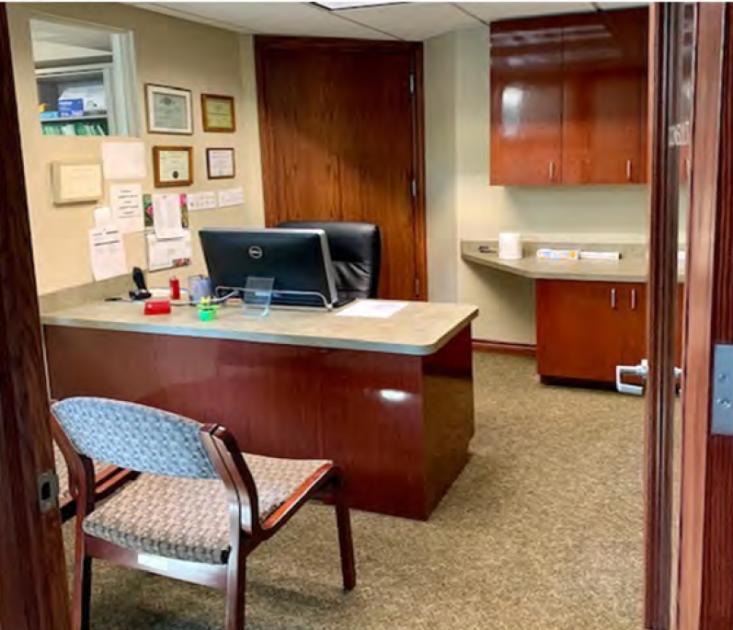
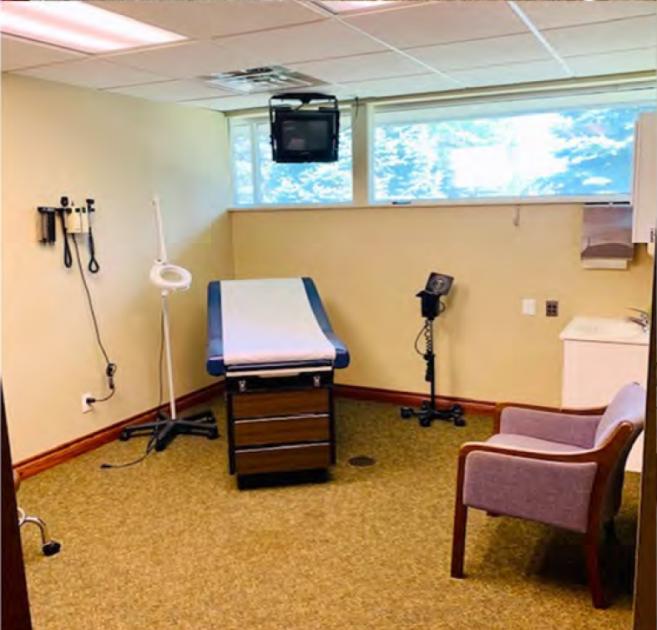
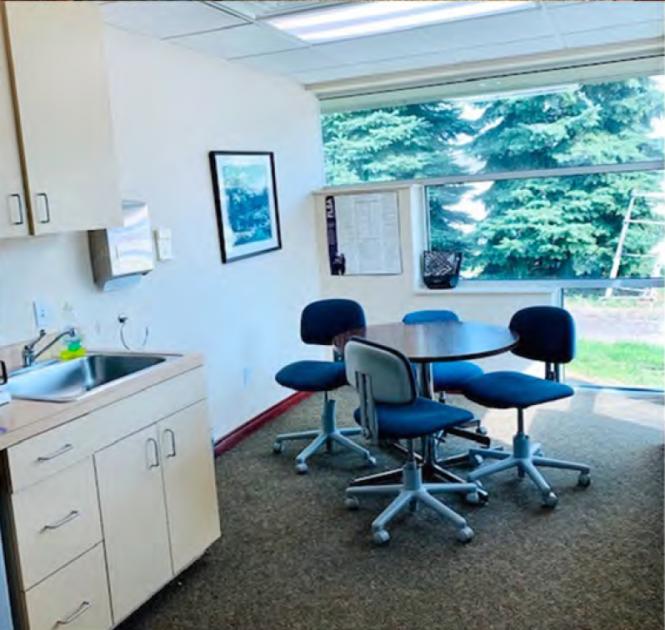
Additional Photos
Listing Agents

Joshua Zeid
O: 248-496-0768
jzeid@sbre1.com
O: 248-496-0768
jzeid@sbre1.com
While we strive to provide the most accurate information, all listing information, and demographic data, is provided by third-parties. As such, MyEListing will not be responsible for the accuracy of the information. It is strongly recommended that you verify all information with the listing agent, and any relevant agencies, prior to making any decisions.