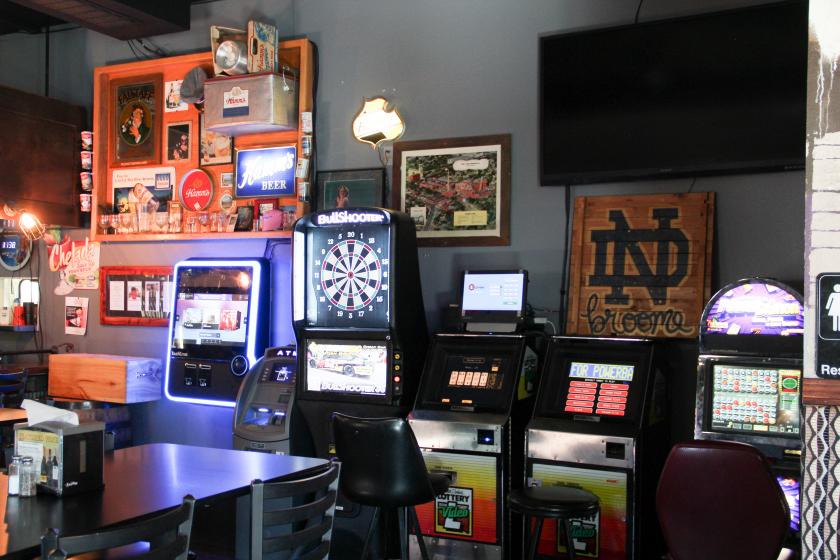
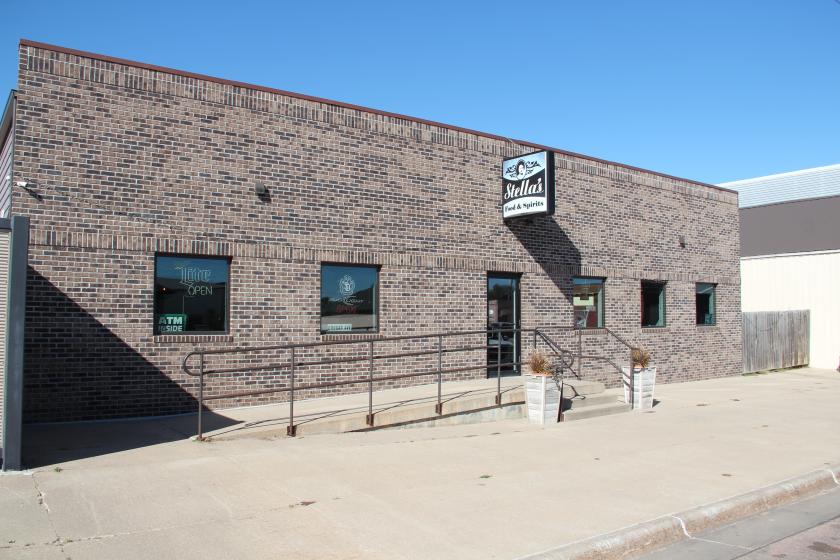
Retail Space
817 Main Street Burke, SD 57523
817 Main Street Burke, SD 57523
Details & Description
Property Highlights
- • 98 out of 100 health inspection August 2021
- • Geothermal 3 units with electric backup
- • Staffing 20 people all part-time
- • Bathrooms 2 handicapped accessible
- • Walk-in freezer
- • Walk-in refrigerator
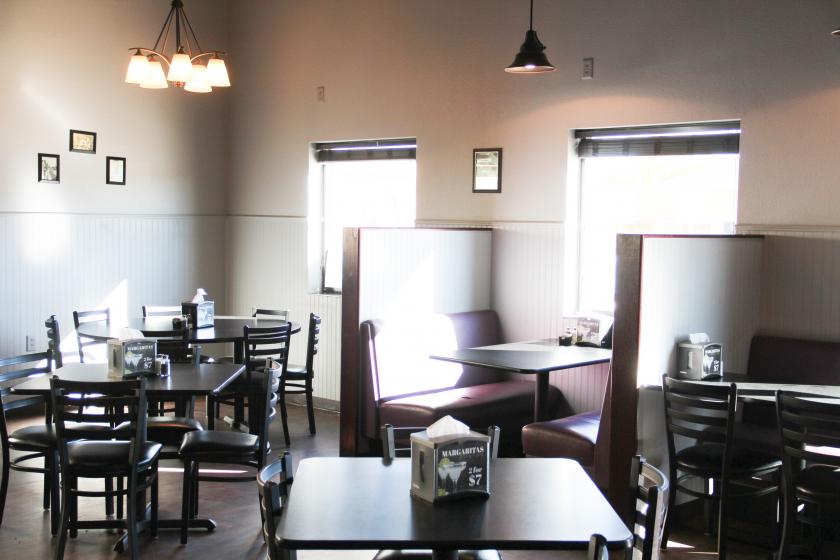
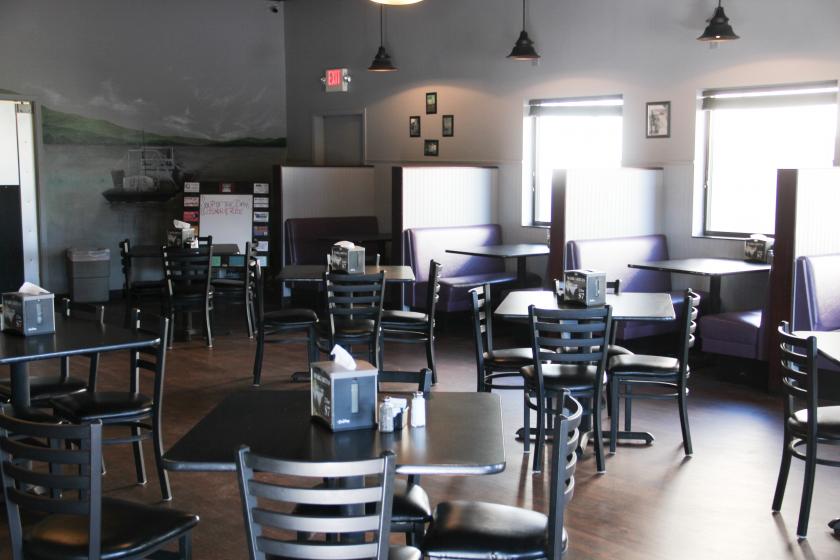
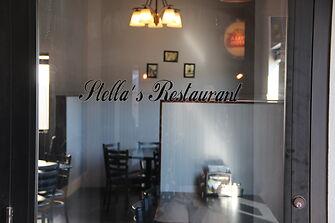
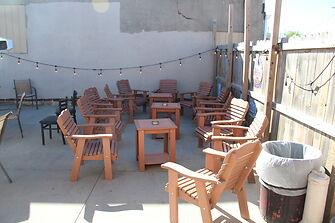
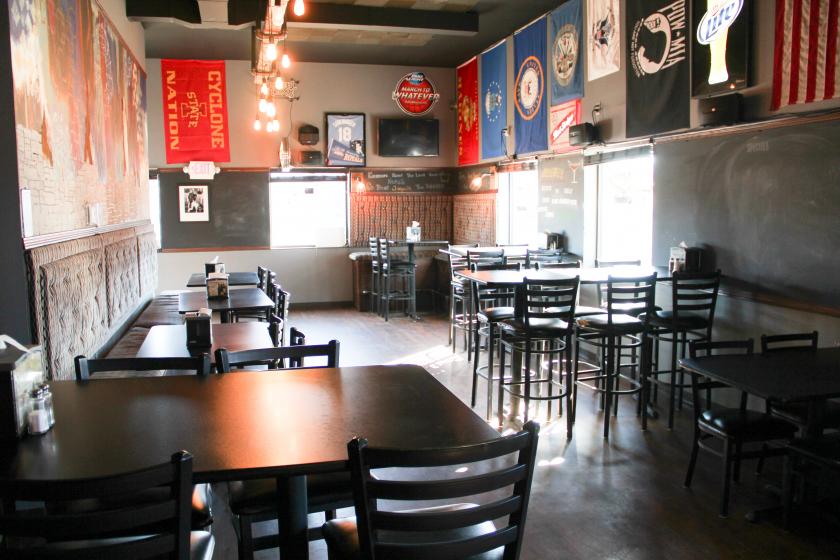
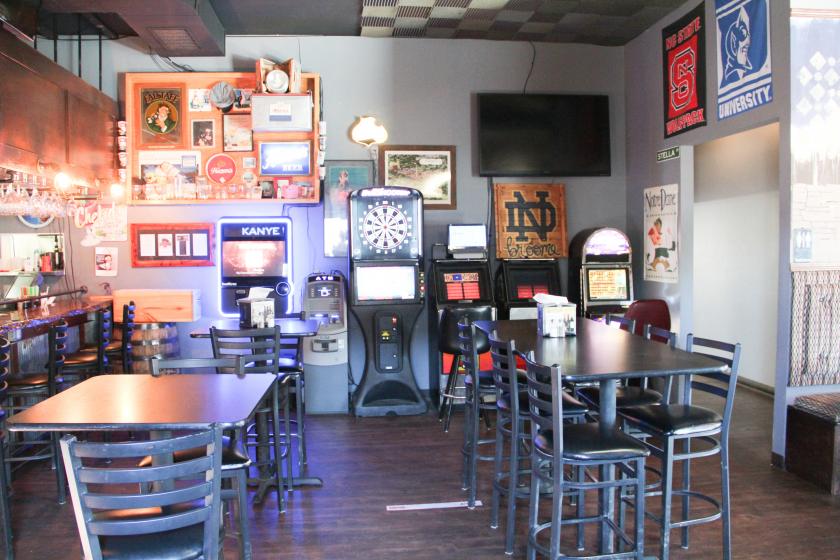
Additional Photos


Listing Agents

Robert Moyer
O: 605-842-3212
robbiemoyer100@gmail.com
O: 605-842-3212
robbiemoyer100@gmail.com
While we strive to provide the most accurate information, all listing information, and demographic data, is provided by third-parties. As such, MyEListing will not be responsible for the accuracy of the information. It is strongly recommended that you verify all information with the listing agent, and any relevant agencies, prior to making any decisions.