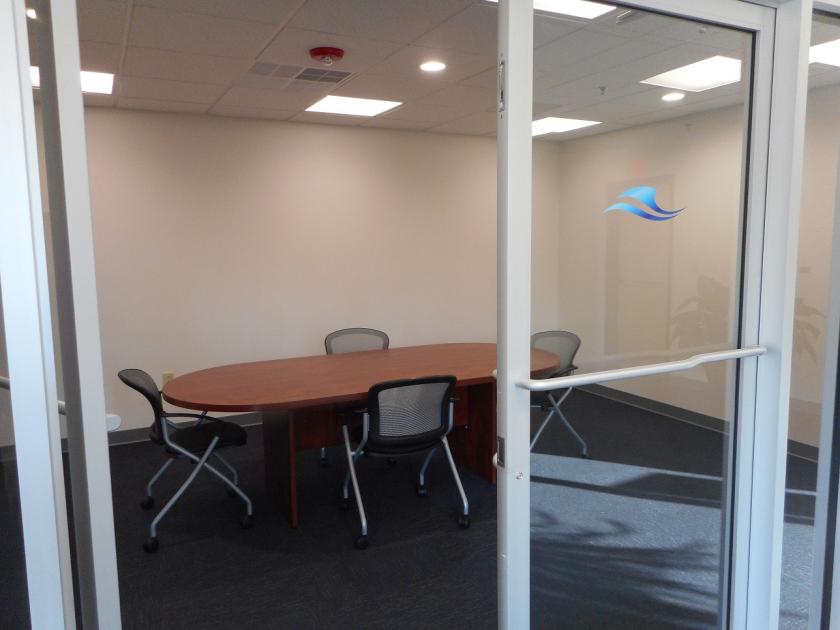
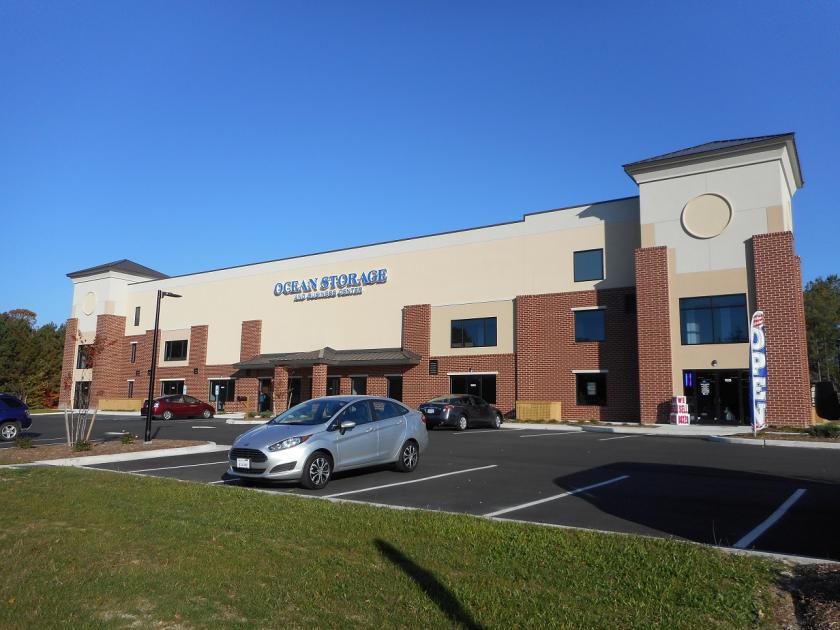
Office Space
105 Professional Parkway Yorktown, VA 23693
105 Professional Parkway Yorktown, VA 23693

Details & Description
Property Highlights
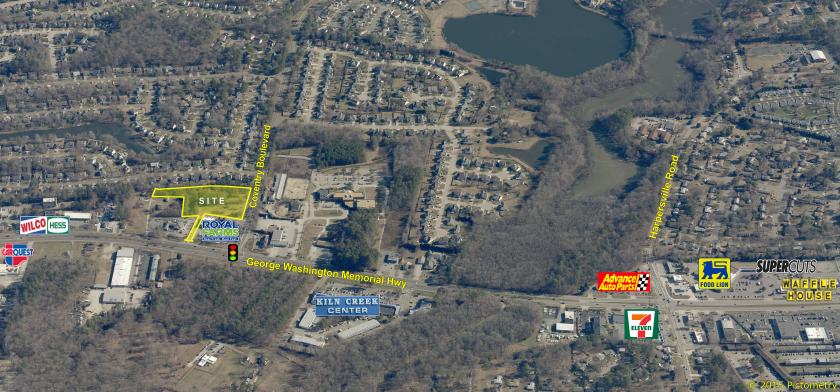
• Ideally located at intersection of George Washington Memorial Highway Coventry Boulevard
• Ideally located at intersection of George Washington Memorial Highway Coventry Boulevard
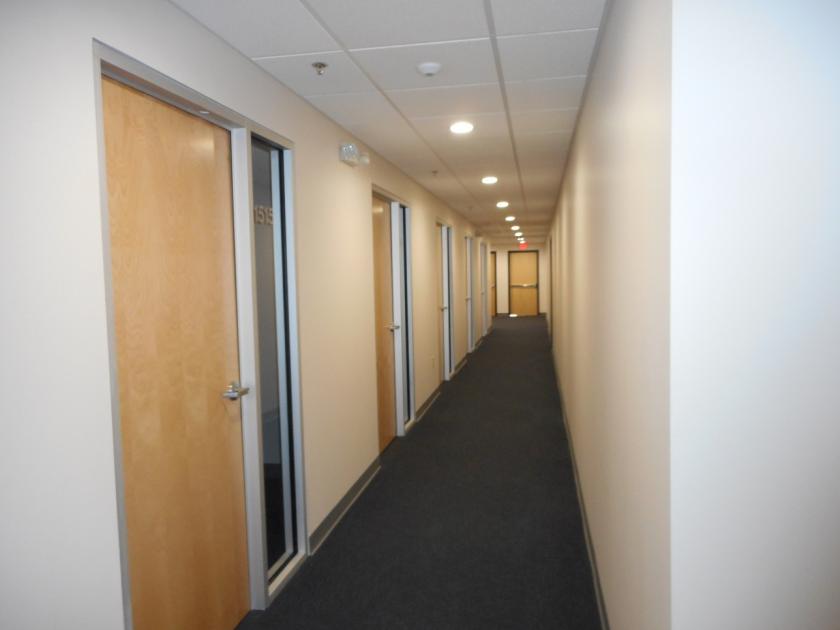
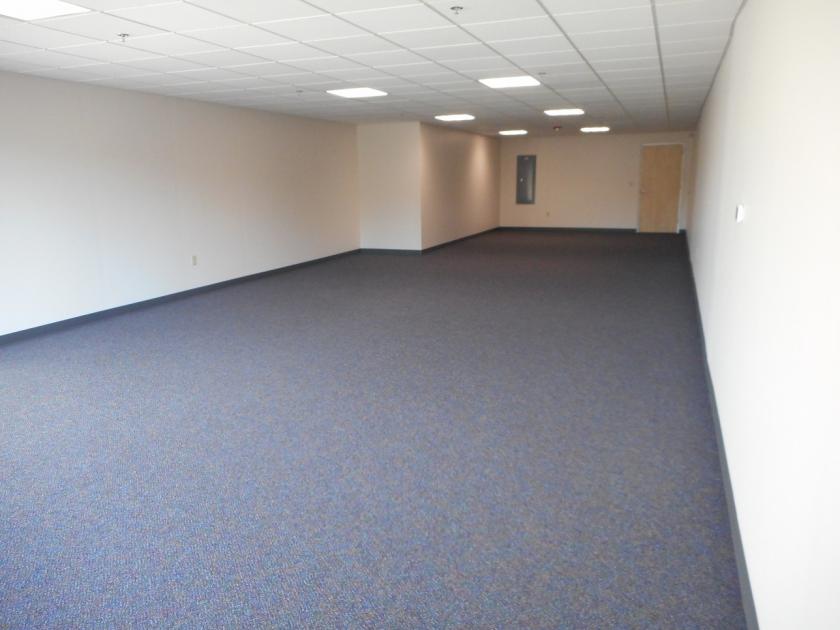
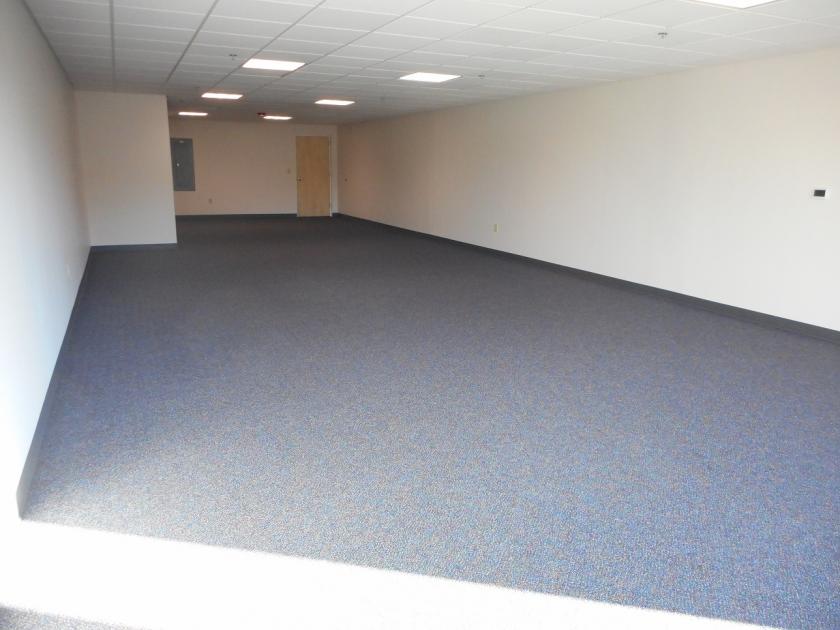
Additional Photos
Listing Agents

Robert Duckett
O: 757-897-2320
rduckett@midatlanticcommercial.com
O: 757-897-2320
rduckett@midatlanticcommercial.com
While we strive to provide the most accurate information, all listing information, and demographic data, is provided by third-parties. As such, MyEListing will not be responsible for the accuracy of the information. It is strongly recommended that you verify all information with the listing agent, and any relevant agencies, prior to making any decisions.