Heavy Power 800 AMP-480208 3 PH
Interchange Distance I-76 0.75 mile
Drive-in doors 1 16 x 18 1 12 x 16 2 10 x 10
New radiant tube heating in warehouse manufacturing areas
Cranes 2 5 Ton with 18 under hook 2 2 Ton
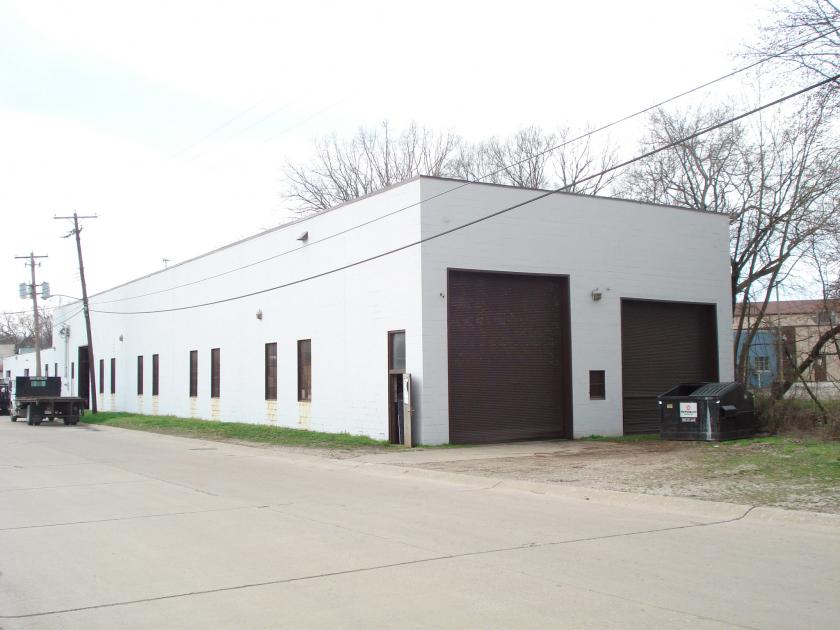
For Sale or Lease: 17,298 SF, manufacturing facility w/ 1,888 SF, office and 15,410 SF manufacturing warehouse.; 800 AMP-480/208 3 PH; Cranes: (2) 5 Ton (2) 2 Ton. Ceiling heights from 14’-22’. Multiple drive-in doors. New roof (2009) and new radiant tube heating in warehouse manufacturing areas.
• Available: 17,298 SF
• Office: 1,888 SF / Warehouse: 15,410 SF
• Sale Price: $490,000 (Price PSF: $28.33)
• Lease Rate: $4.00 SF (Gross)
• Zoning: I-2 Industrial
• Restrooms: (2) Office (1) Shop
• Acres: 0.91
• Frontage: 433’
• Power: 3phase, 480/208 volt, 800 amps
• Clear Height: 14’ 16’ 22’
• Drive-in Doors: (1) 16’ x 18’ (1) 12’ x 16’ (2) 10’ x 10’
• Cranes: (2) 5 Ton with 18’ under hook (2) 2 Ton
• Interchange / Distance: I-76 / 0.75 mile
No part of this information may be copied, reproduced, repurposed, or screen-captured for any commercial purpose without prior written authorization from MyEListing.
While we strive to provide the most accurate information, all listing information, and demographic data, is provided by third-parties. As such, MyEListing will not be responsible for the accuracy of the information. It is strongly recommended that you verify all information with the listing agent, and any relevant agencies, prior to making any decisions.
What is the asking price for 1050-1056 Eagon Street in Barberton?
The asking price for 1050-1056 Eagon Street is $490,000
What is the building size of this Industrial property in Barberton, OH?
The size of the building/unit at 1050-1056 Eagon Street in Barberton is 17,298 square feet
How much land does the Barberton, OH property at 1050-1056 Eagon Street include?
1050-1056 Eagon Street in Barberton includes 0.910 acres of land
What kind of Industrial is the propery at 1050-1056 Eagon Street?
The property at 1050-1056 Eagon Street Barberton, OH 44203 is listed as a Warehouse Industrial property
What is the population within 1 mile of 1050-1056 Eagon Street in Barberton?
The population within 1 mile of 1050-1056 Eagon Street Barberton, OH 44203 is 9,365 people.
Who do I contact for questions about 1050-1056 Eagon Street?
You should contact the listing agent,
Bob Raskow, for any details regarding this commercial listing.