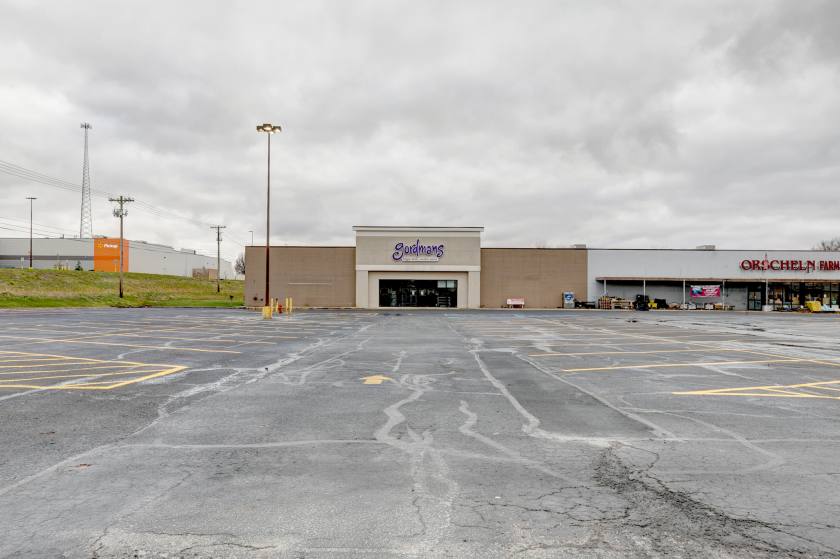
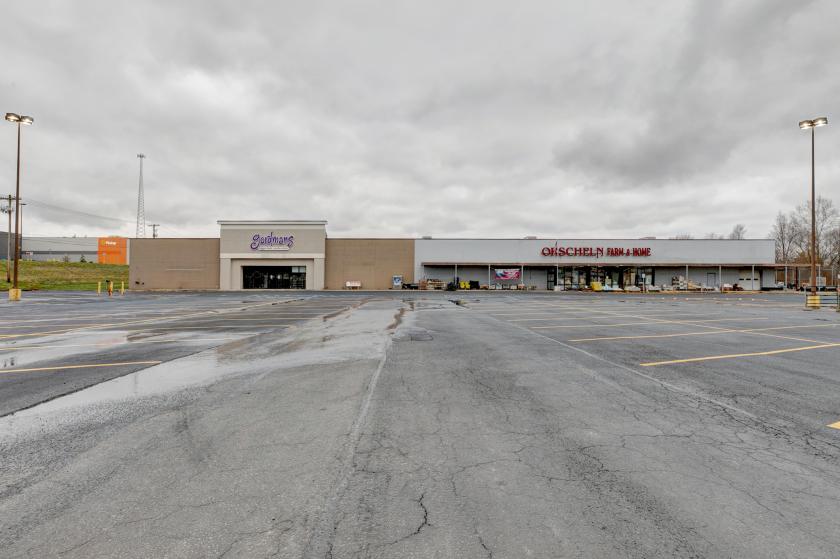
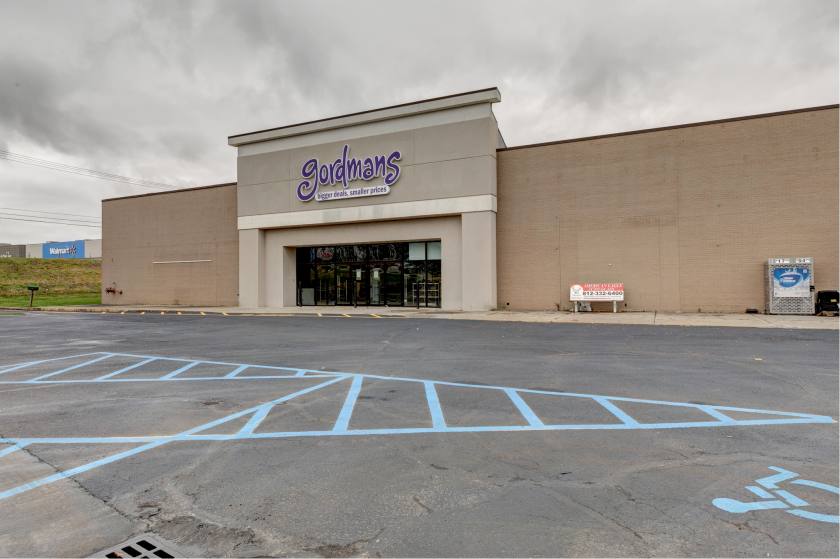
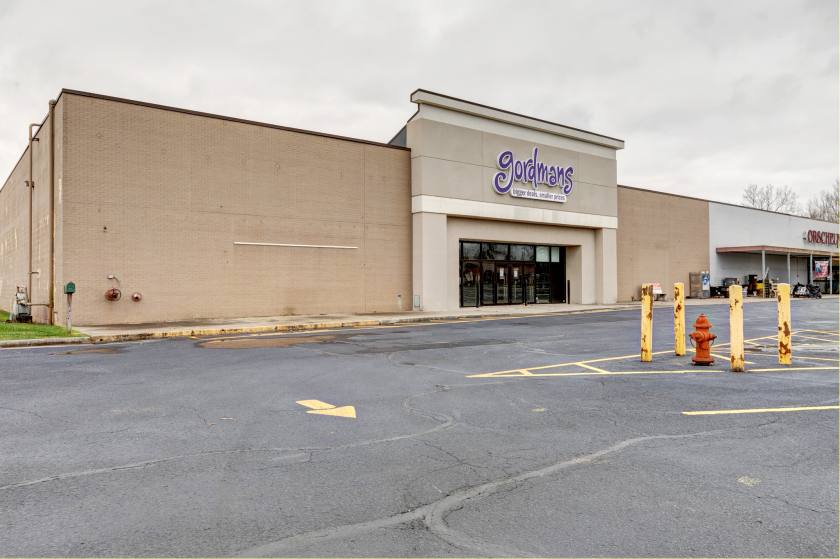
Retail Space
2145 Indiana 54 Linton, IN 47441
2145 Indiana 54 Linton, IN 47441
Details & Description
Property Highlights
• Businesses at this intersection include Walmart, Burger King, Murphy USA gas station, First Financial Bank
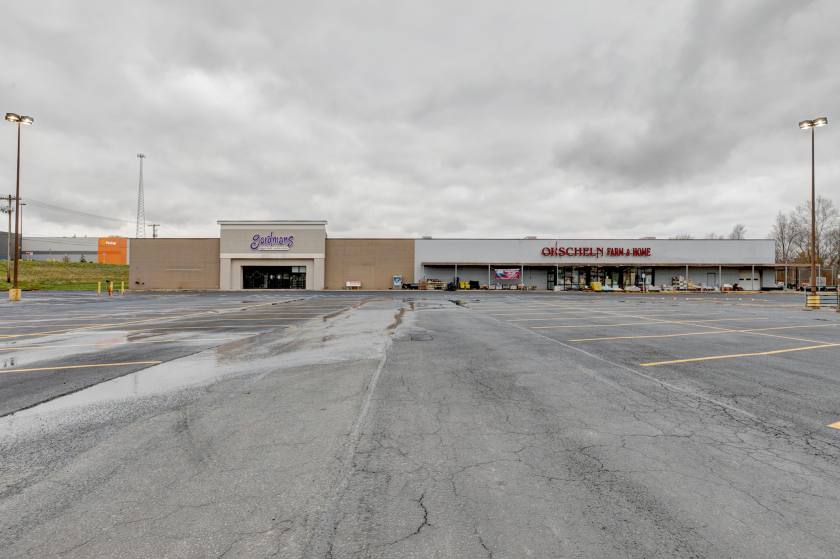
• 52,542 Sq Ft retail building for sale for $2,300,000. No zoning restrictions in Greene County
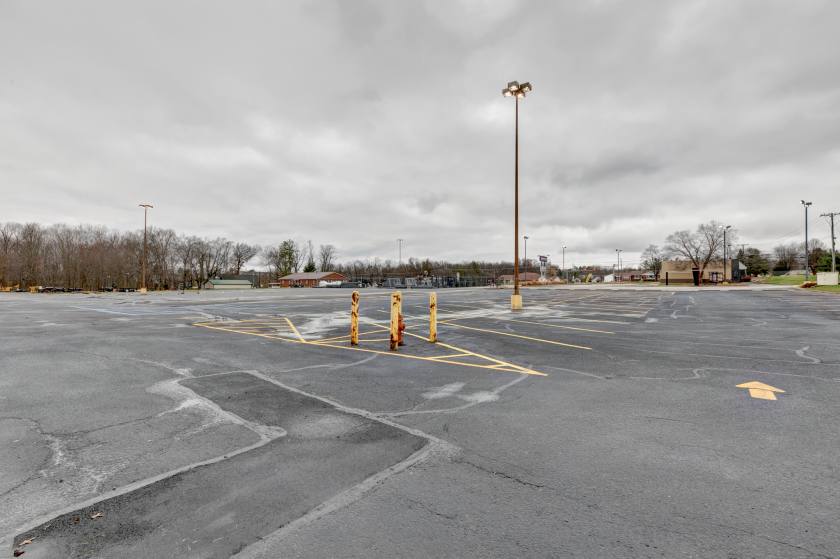
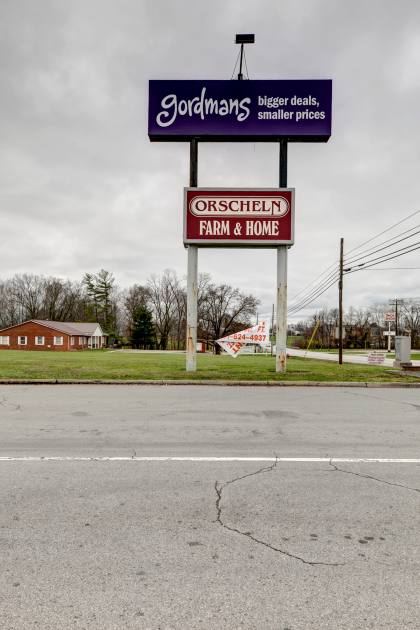
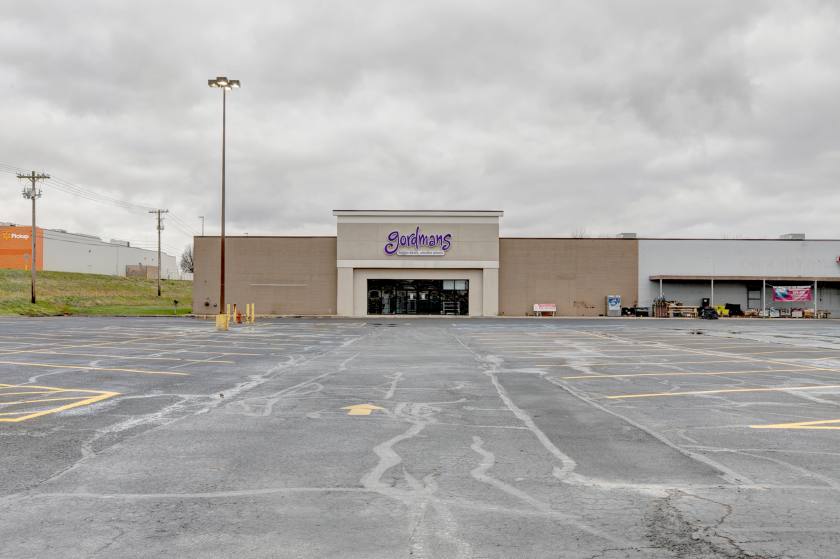
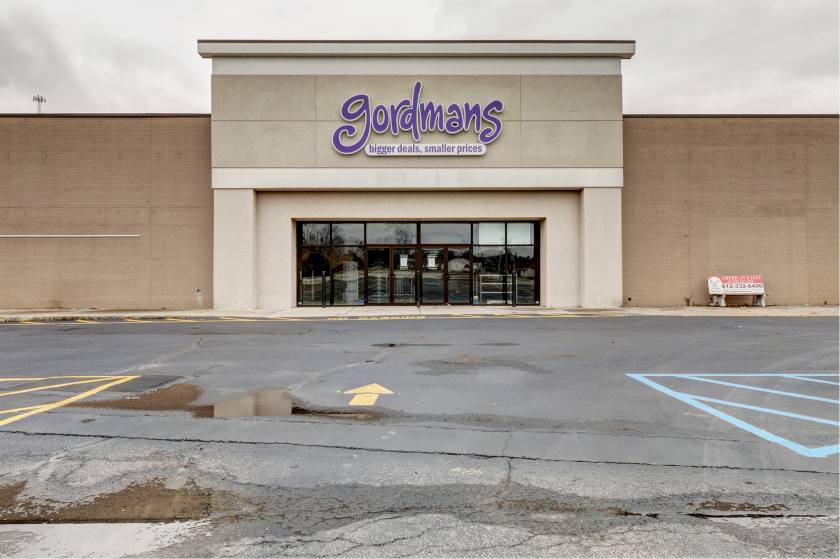
Additional Photos

Listing Agents

Craig Dohman
O: 812-558-2357
M: 812-606-0136
cdohman@c21cre.com
O: 812-558-2357
M: 812-606-0136
cdohman@c21cre.com
While we strive to provide the most accurate information, all listing information, and demographic data, is provided by third-parties. As such, MyEListing will not be responsible for the accuracy of the information. It is strongly recommended that you verify all information with the listing agent, and any relevant agencies, prior to making any decisions.