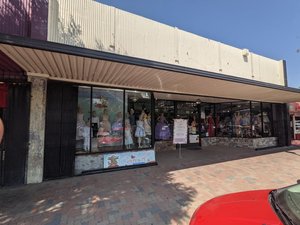
1-Mile | 3-Miles | 5-Miles | ||
---|---|---|---|---|
Total Population | 17,168 | 39,156 | 51,239 | |
Population Median Age | 33 | 33 | 33 | |
Population by Age | 0-9 Yrs | 2900 (16%) | 6493 (16%) | 7376 (14%) |
10-19 Yrs | 2899 (16%) | 6450 (16%) | 7618 (14%) | |
20-29 Yrs | 2804 (16%) | 7196 (18%) | 10293 (20%) | |
30-39 Yrs | 2278 (13%) | 5044 (12%) | 7921 (15%) | |
40-49 Yrs | 1794 (10%) | 4542 (11%) | 6583 (12%) | |
50-59 Yrs | 1658 (9%) | 3756 (9%) | 4996 (9%) | |
60-69 Yrs | 1521 (8%) | 3002 (7%) | 3441 (6%) | |
70+ Yrs | 1314 (7%) | 2673 (6%) | 3011 (5%) | |
Median HH Income | $34,455 | $39,633 | $42,036 | |
Total Household Income | < 24K | 1496 (30%) | 2790 (27%) | 3023 (26%) |
25-49K | 1774 (36%) | 3302 (32%) | 3599 (31%) | |
50-74K | 657 (13%) | 1812 (17%) | 2160 (18%) | |
75-99K | 381 (7%) | 897 (8%) | 1106 (9%) | |
100-199K | 516 (10%) | 1321 (12%) | 1480 (12%) | |
200K+ | 55 (1%) | 120 (1%) | 142 (1%) | |
Highest Education Level | No Diploma | 4314 | 9386 | 13111 |
Diploma or GED | 2770 | 6175 | 8778 | |
Some College | 1607 | 3917 | 5468 | |
Assoc. Degree | 446 | 987 | 1353 | |
Bachelors Degree | 735 | 1639 | 1860 | |
Higher Degree | 165 | 344 | 408 | |
Total Housing Units | 5,371 | 11,031 | 12,341 | |
--Owner-Occupied | 2,329 | 5,493 | 6,443 | |
--Renter-Occupied | 2,549 | 4,748 | 5,068 | |
Owner-Occupied Values | < 100K | 221 | 576 | 675 |
100-199K | 1238 | 2742 | 3204 | |
200-299K | 667 | 1598 | 1885 | |
300-399K | 129 | 295 | 356 | |
400-499K | 28 | 153 | 184 | |
500K+ | 46 | 129 | 140 | |
Total Working Age Population | 12,546 | 28,844 | 39,339 | |
In Work Force | 7,372 | 17,629 | 20,459 | |
Not In Work Force | 5,174 | 11,215 | 18,880 | |
Workforce Employed | 6,681 | 15,850 | 18,131 | |
Workforce Unemployed | 692 | 1,779 | 2,328 | |
Civlian Workforce | 7,372 | 17,629 | 20,459 | |
Military Workforce | 0 | 0 | 0 | |
Total Households | 4,878 | 10,241 | 11,511 | |
Family Households | 3,987 | 8,820 | 10,012 | |
Non-Family Households | 891 | 1,421 | 1,500 | |
Married Couple | 2,733 | 6,135 | 7,057 | |
Other Family | 1,254 | 2,685 | 2,955 | |
Married w/Child | 1,410 | 3,443 | 4,066 | |
Single Male w/Child | 81 | 173 | 192 | |
Single Female w/Child | 574 | 1,266 | 1,408 |
Population Change Last Two Decades - Plus Projection
2000 | % | 2010 | % | 2020 | % | 2030 | |
---|---|---|---|---|---|---|---|
California | 33,871,648 | +10 | 37,253,956 | +9 | 40,467,295 | +8 | 43,631,295 |
Kern County | 661,645 | +27 | 839,631 | +11 | 928,308 | +14 | 1,062,325 |
Tulare County | 368,021 | +20 | 442,179 | +10 | 486,677 | +11 | 538,641 |
Total Working Age Population:
Total Households:
Total Working Age Population:
Total Households:
Total Working Age Population:
Total Households: