Specialty Real Estate
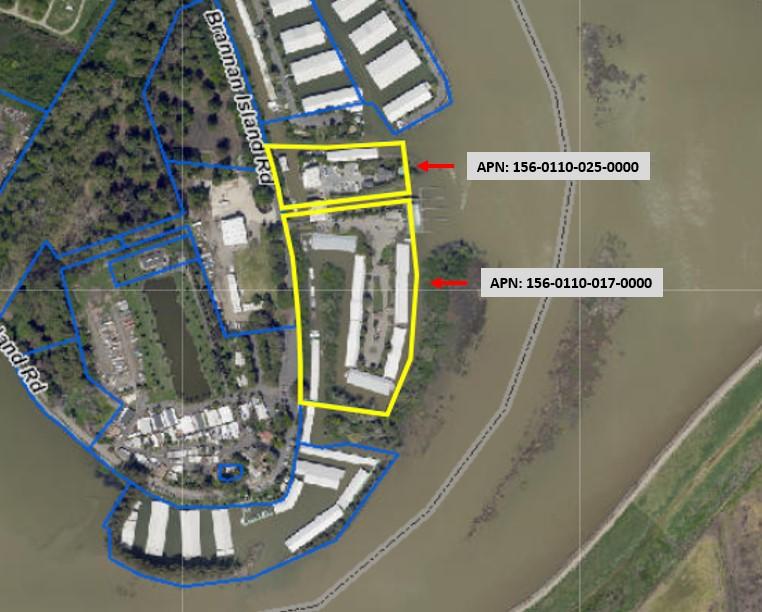
106 West Brannan Island Road Isleton, CA 95641
106 West Brannan Island Road Isleton, CA 95641
Details & Description
Property Highlights
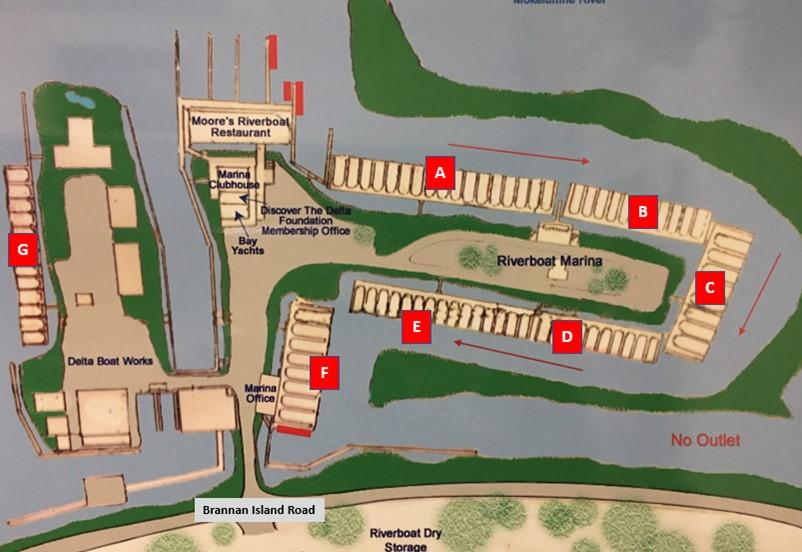
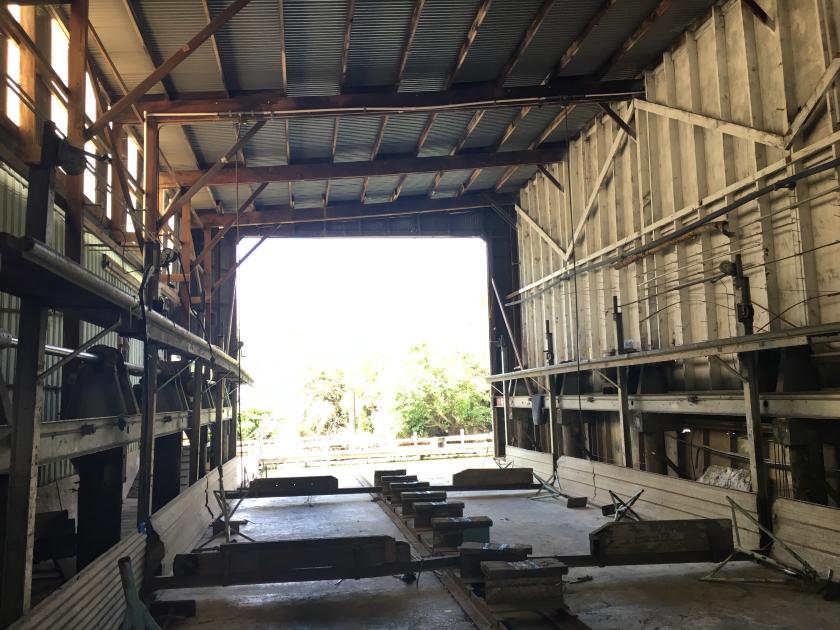
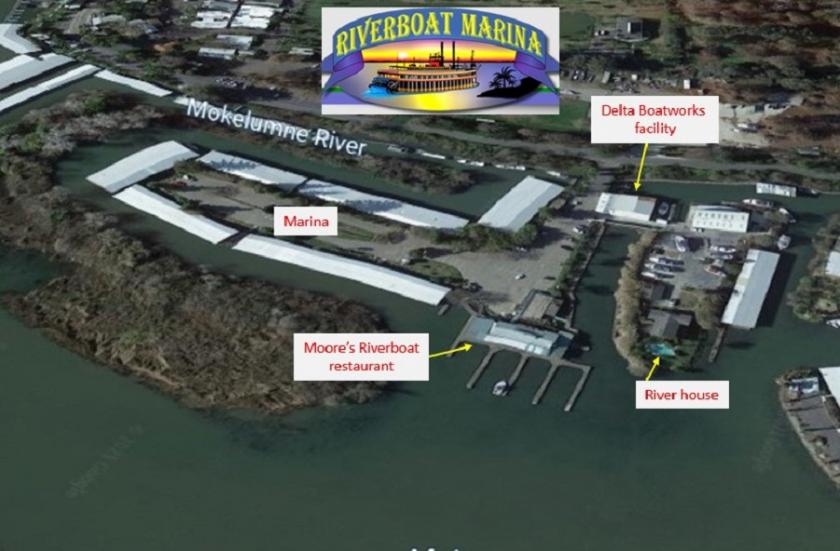
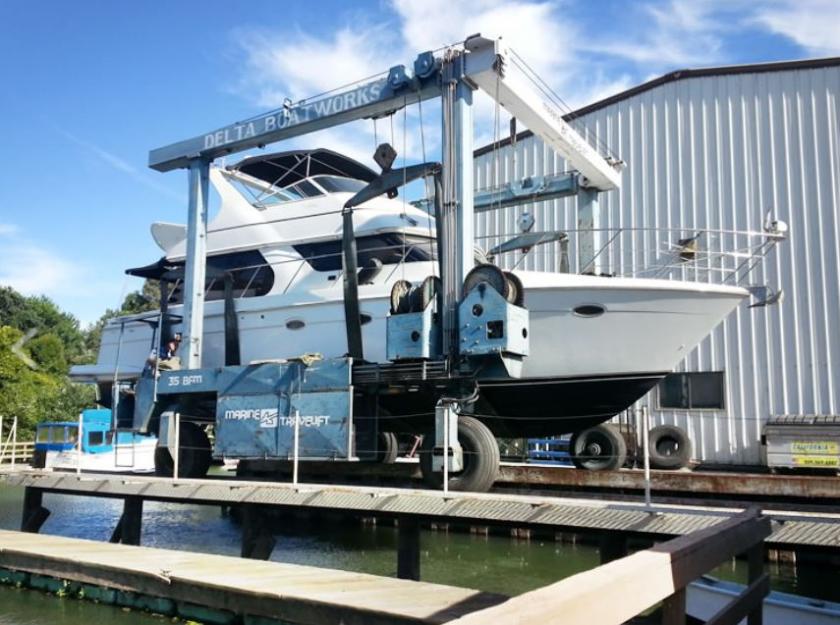
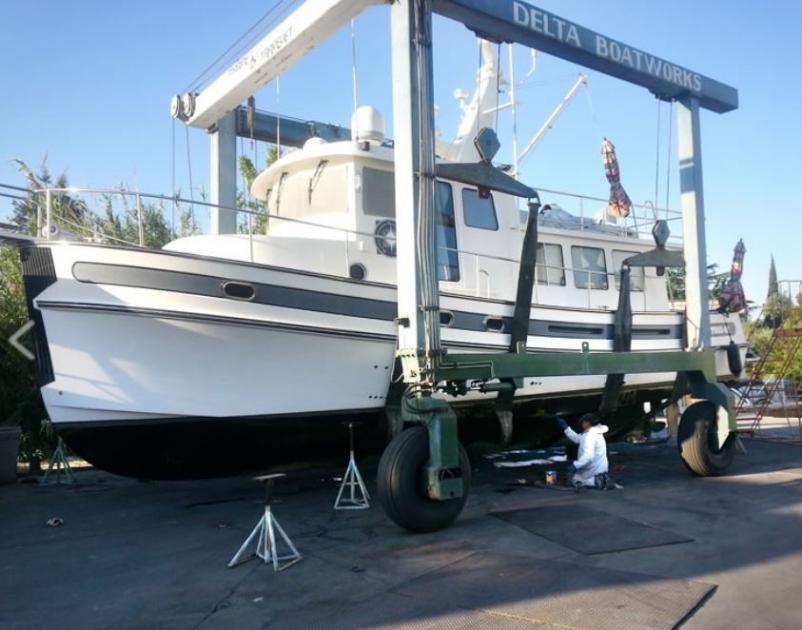
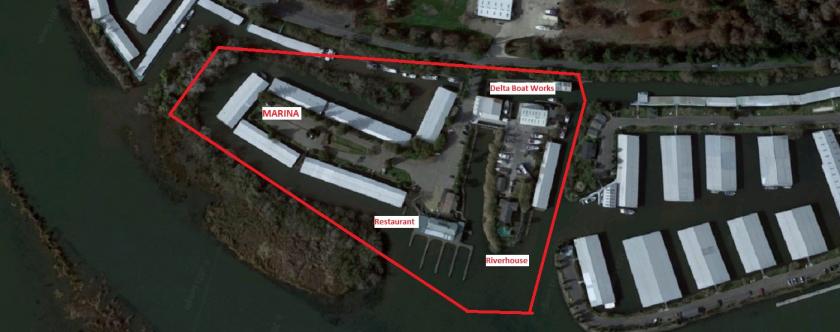
• Delta Boat Works, the premier boat works in The Delta a full service boat yard and parts store
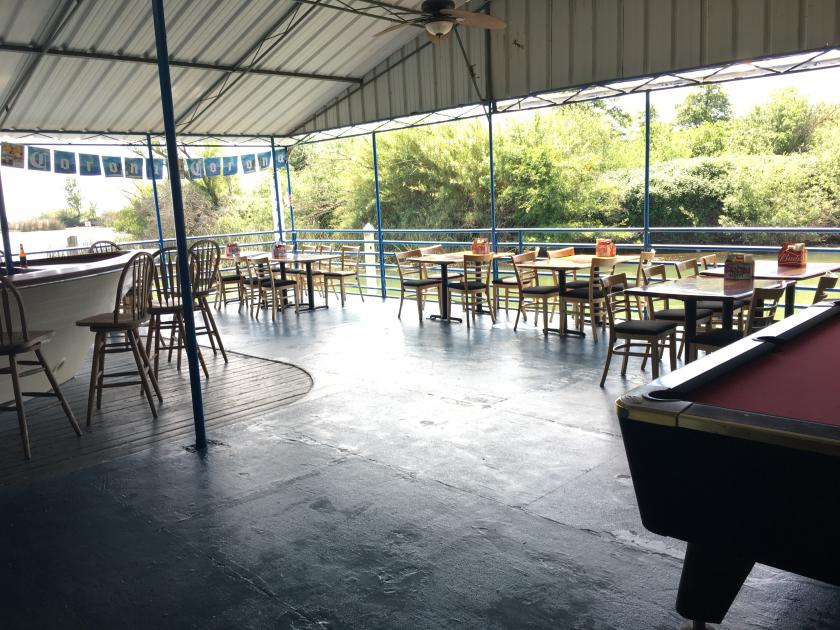
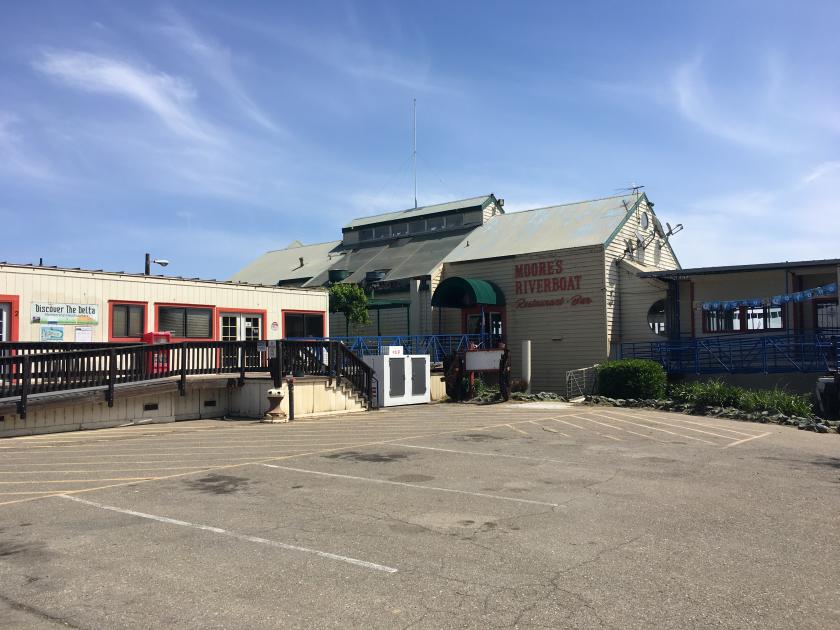
• Moores Riverboat Restaurant serving great food and spirits with weekend entertainment
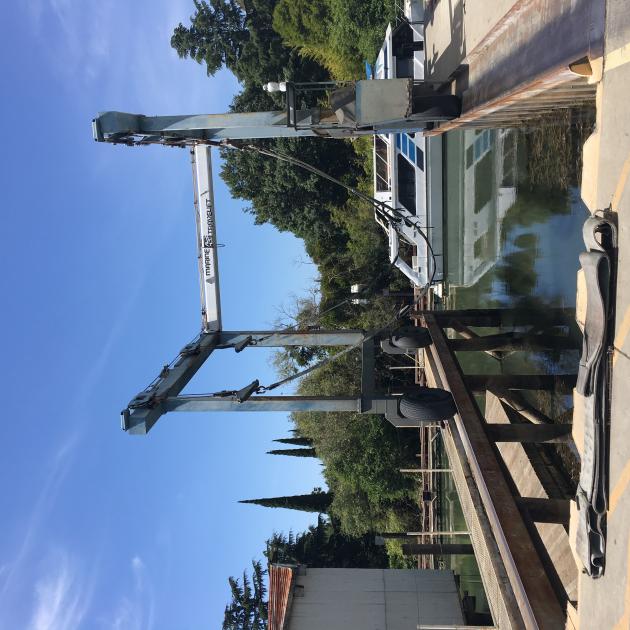
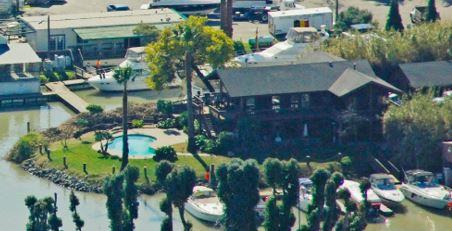
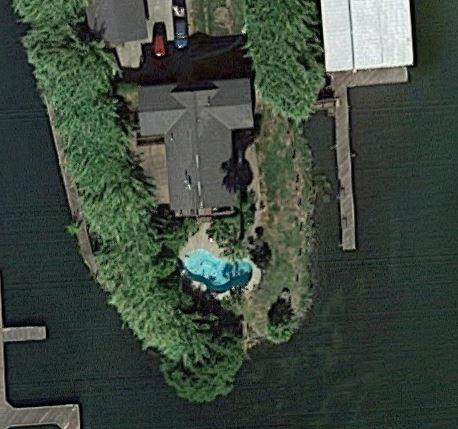
Additional Photos
Listing Agents

Michael Cohen
SVN Commercial Real Estate
O: 415897442222
M: 415-717-9352
Michael.cohen@svn.com
SVN Commercial Real Estate
O: 415897442222
M: 415-717-9352
Michael.cohen@svn.com
While we strive to provide the most accurate information, all listing information, and demographic data, is provided by third-parties. As such, MyEListing will not be responsible for the accuracy of the information. It is strongly recommended that you verify all information with the listing agent, and any relevant agencies, prior to making any decisions.