Retail Space
4854 Longhill Road Williamsburg, VA 23188
4854 Longhill Road Williamsburg, VA 23188
Details & Description
Property Highlights
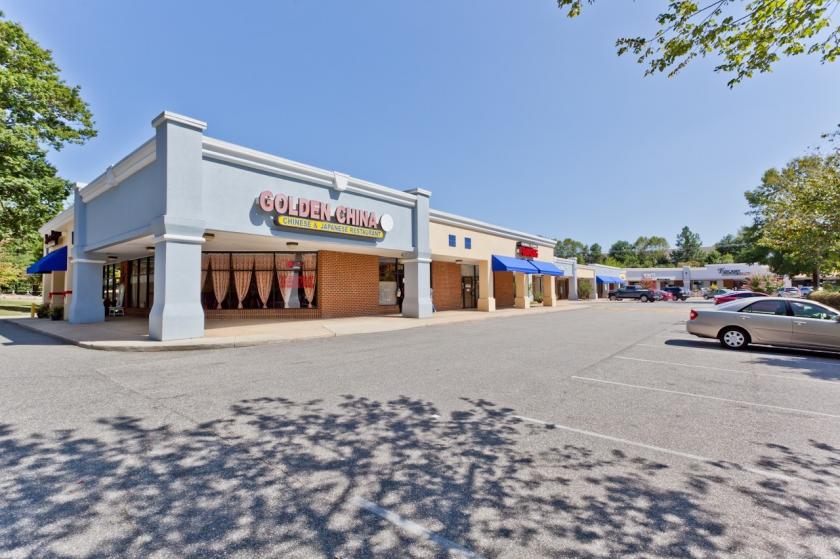
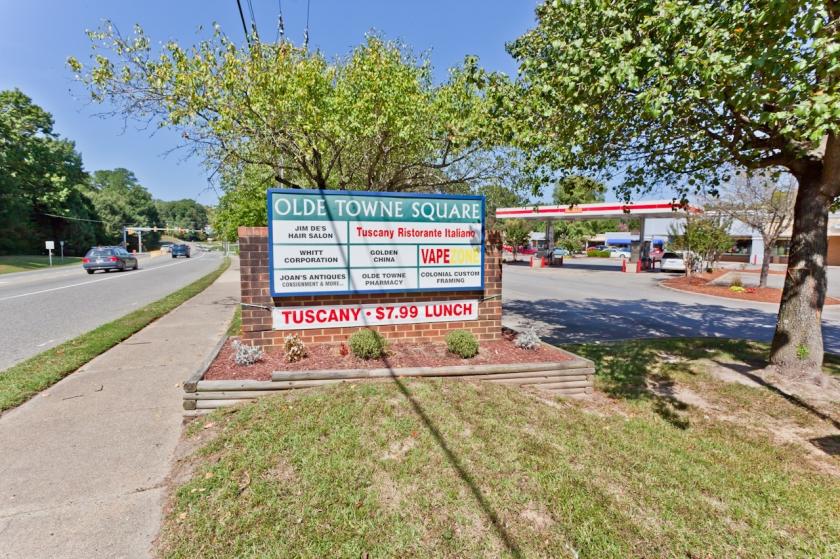
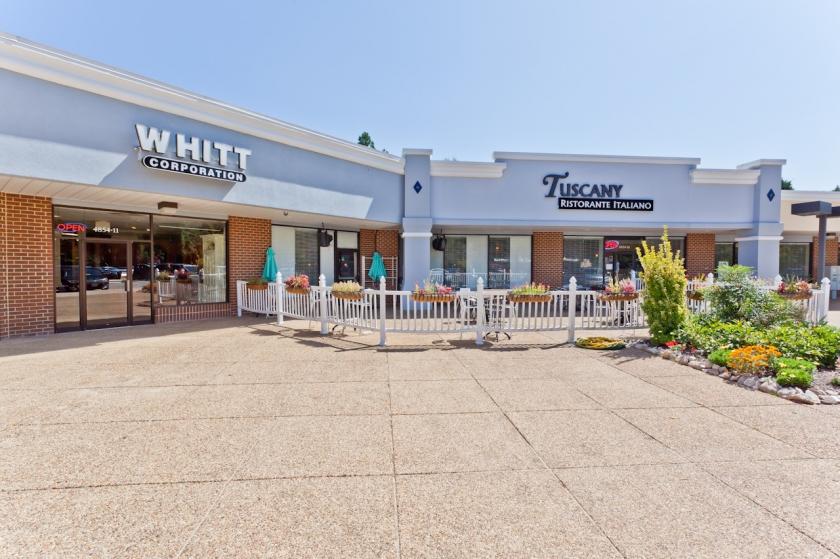
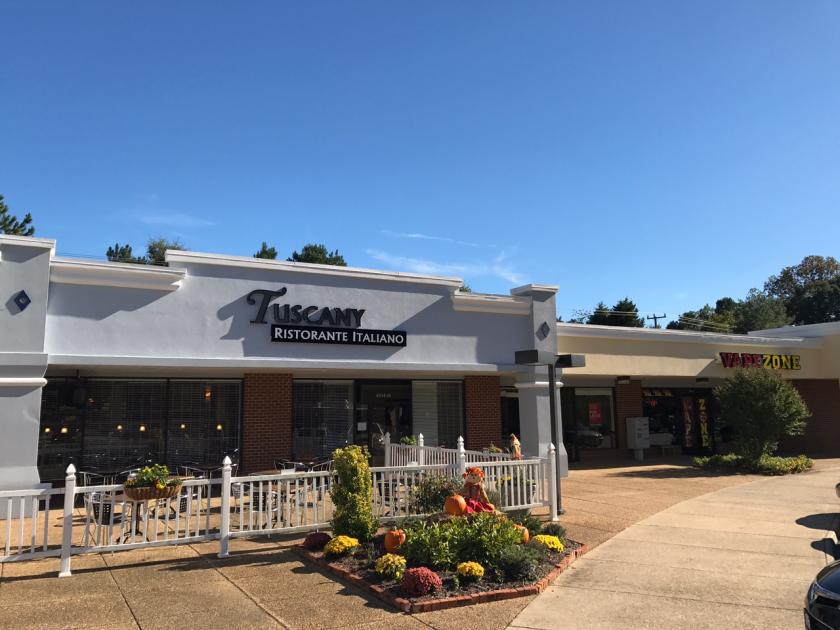
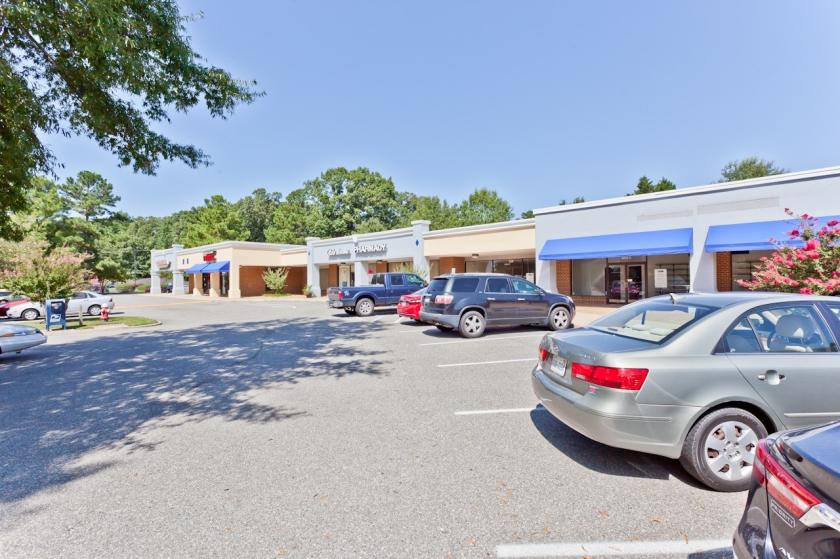
• Picture your business in this upscale and attractive shopping center
• Picture your business in this upscale and attractive shopping center
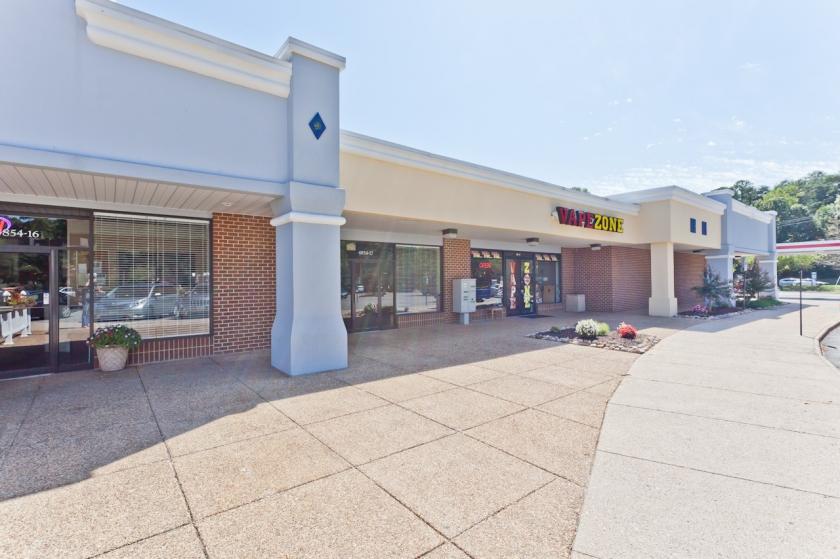
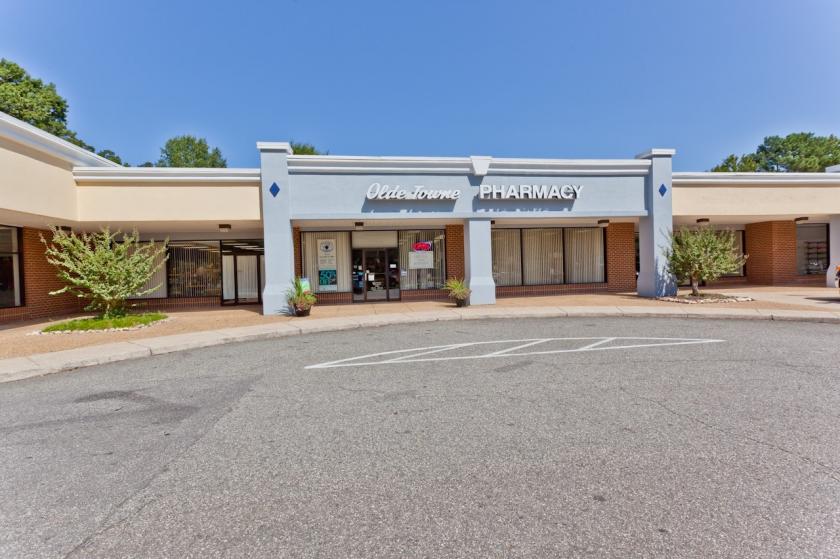
Additional Photos
Listing Agents

Robert Duckett
O: 757-897-2320
rduckett@midatlanticcommercial.com
O: 757-897-2320
rduckett@midatlanticcommercial.com
While we strive to provide the most accurate information, all listing information, and demographic data, is provided by third-parties. As such, MyEListing will not be responsible for the accuracy of the information. It is strongly recommended that you verify all information with the listing agent, and any relevant agencies, prior to making any decisions.