Commercial Land
Center Avenue Oostburg, WI 53070
Center Avenue Oostburg, WI 53070
Details & Description
Property Highlights
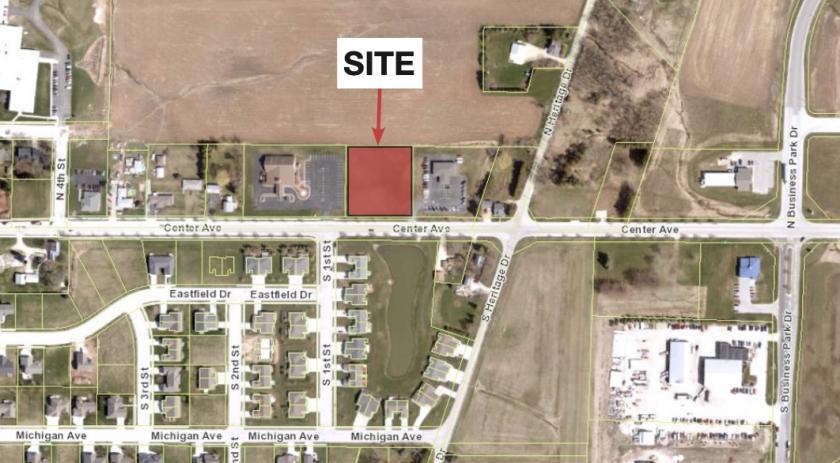
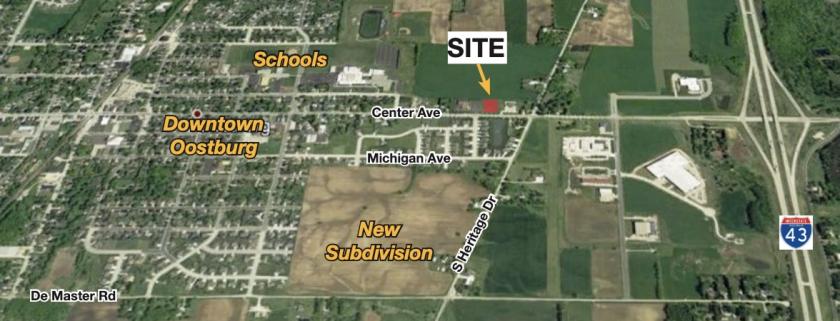
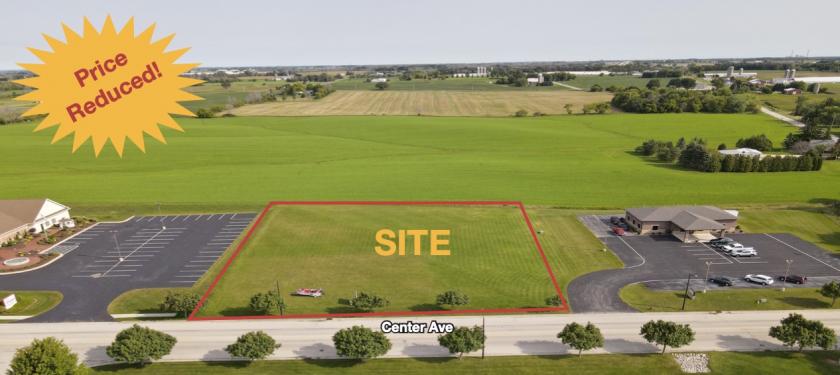
• Perfect location for a business in Oostburg. Growing community
• Located on a heavily traveled main commercial road
Listing Agents

Dane Checolinski
O: 920-783-6330
M: 920-344-8732
danec@naipfefferle.com
O: 920-783-6330
M: 920-344-8732
danec@naipfefferle.com
While we strive to provide the most accurate information, all listing information, and demographic data, is provided by third-parties. As such, MyEListing will not be responsible for the accuracy of the information. It is strongly recommended that you verify all information with the listing agent, and any relevant agencies, prior to making any decisions.