Industrial Properties
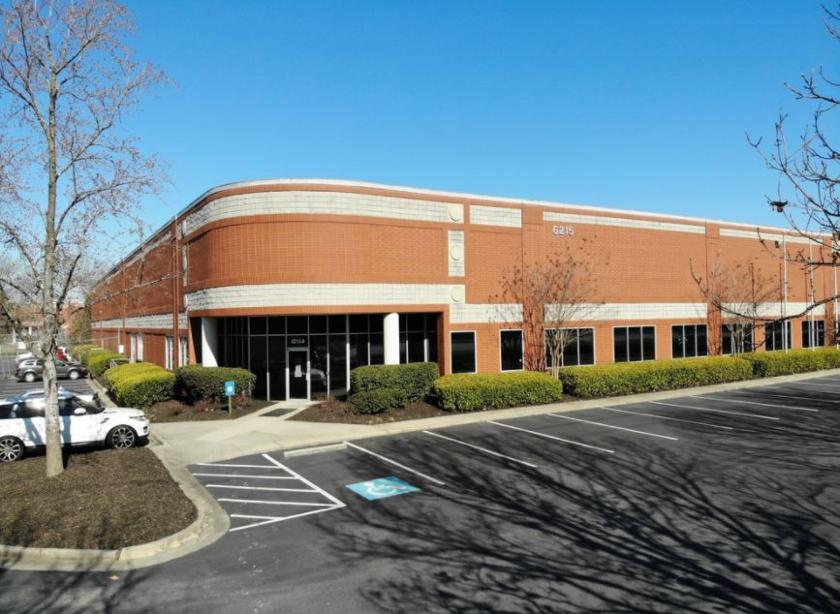
6215 Fulton Industrial Boulevard Southwest Atlanta, GA 30336
6215 Fulton Industrial Boulevard Southwest Atlanta, GA 30336
Details & Description
Property Highlights
- • Fenced Truck Ct
- • Heavy Parking
- • Street Frontage
- • All Brick
- • 18 Docks
- • 2 Drive-In
Listing Agents

John Clancy
O: 678-520-2690
jclancy@peachtreecre.com
O: 678-520-2690
jclancy@peachtreecre.com
While we strive to provide the most accurate information, all listing information, and demographic data, is provided by third-parties. As such, MyEListing will not be responsible for the accuracy of the information. It is strongly recommended that you verify all information with the listing agent, and any relevant agencies, prior to making any decisions.