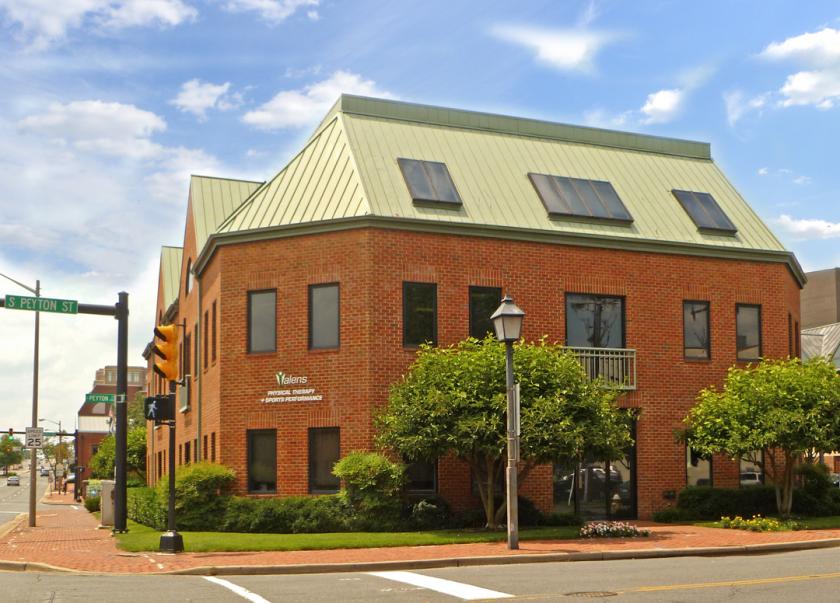
Office Space
1501 Duke Street Alexandria, VA 22314
1501 Duke Street Alexandria, VA 22314

Details & Description
Property Highlights
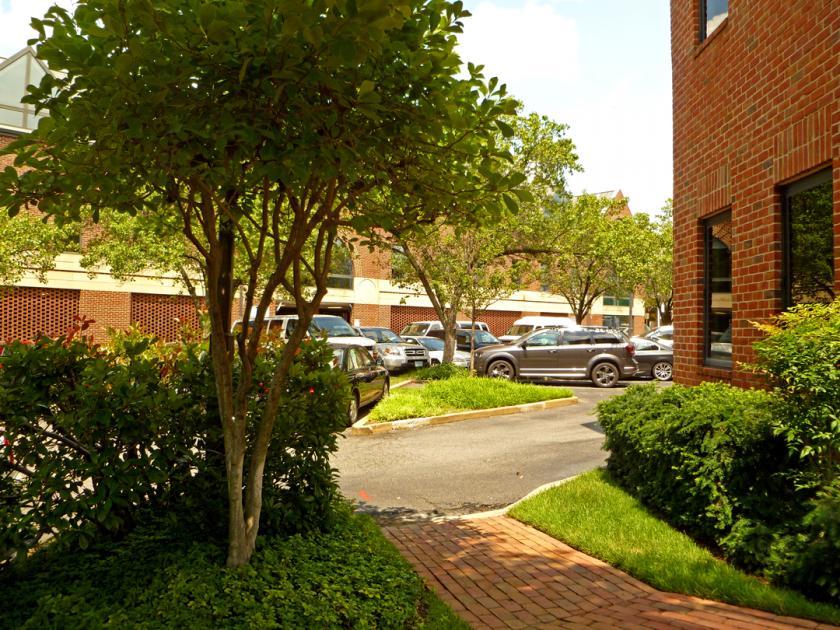
- • Space is in excellent condition
- • Parking included
- • Furniture available
Listing Agents

Bob Swearingen
O: 703-475-2105
M: 703-475-2105
rswearingen@mcenearney.com
O: 703-475-2105
M: 703-475-2105
rswearingen@mcenearney.com
While we strive to provide the most accurate information, all listing information, and demographic data, is provided by third-parties. As such, MyEListing will not be responsible for the accuracy of the information. It is strongly recommended that you verify all information with the listing agent, and any relevant agencies, prior to making any decisions.